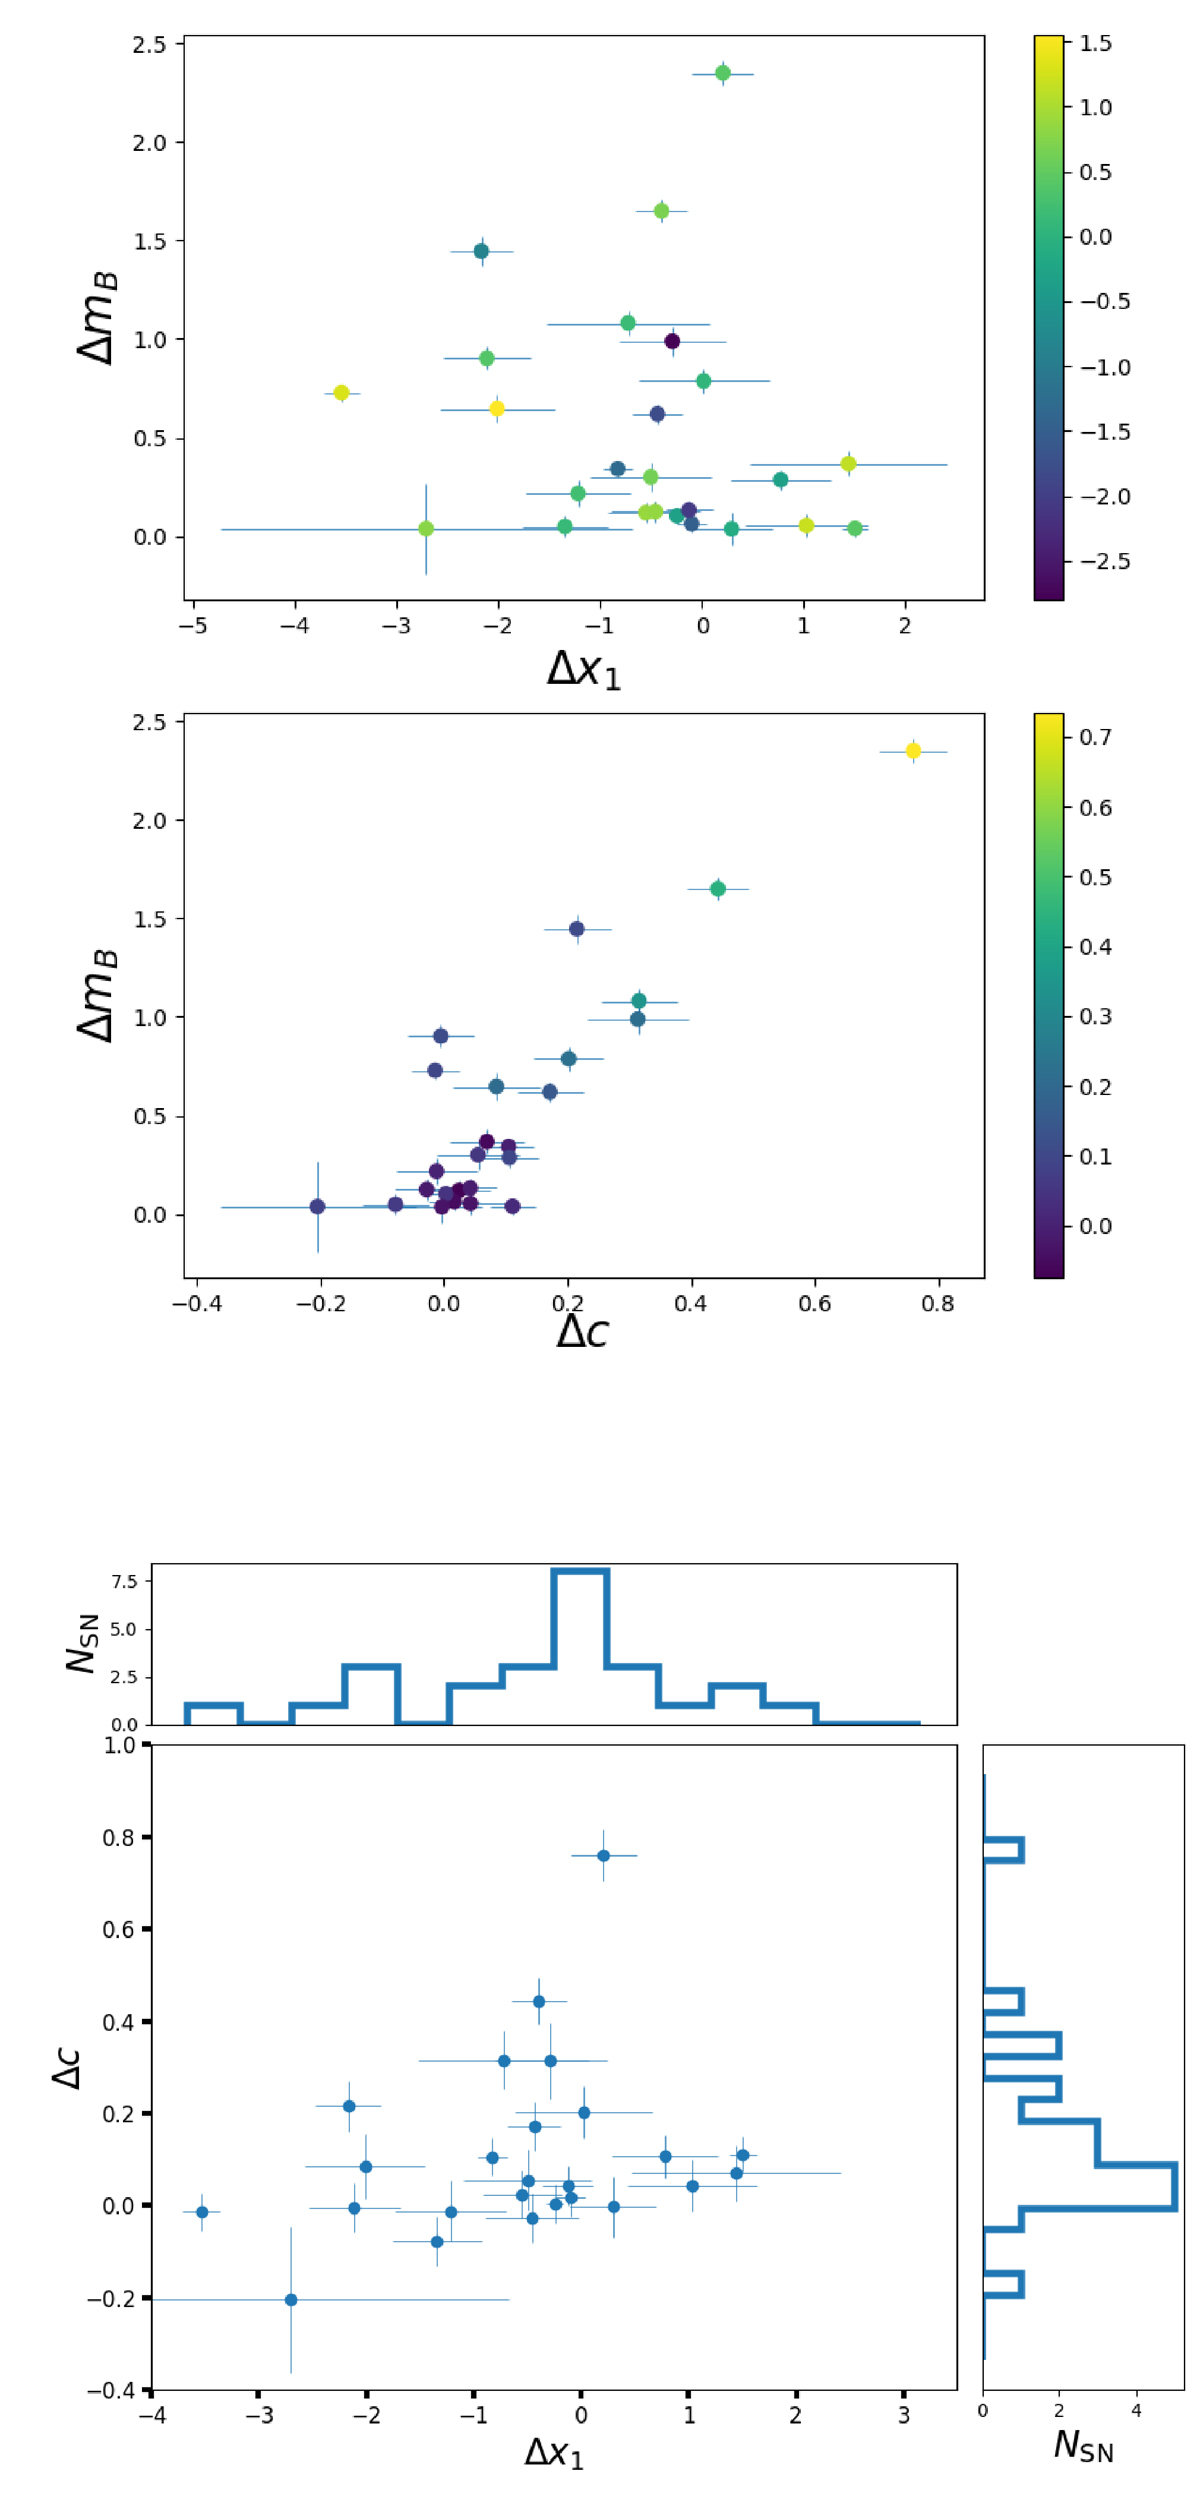
Fig. 4.
Download original image
Difference in the inferred SALT2 mB versus the difference in the inferred x1 (top) and c (middle) for each sibling pair in the sample. The siblings with large differences in x1 (and similar values of c) predominantly constrain α precisely, whereas those with a large Δc constrain β. The colour bar shows the x1 for the wider SN (i.e. higher x1; top) and c for the redder (i.e. higher c; middle) SN Ia in the pair. For better visualisation, we plot the Δx1 versus the Δc in the bottom panel.
Current usage metrics show cumulative count of Article Views (full-text article views including HTML views, PDF and ePub downloads, according to the available data) and Abstracts Views on Vision4Press platform.
Data correspond to usage on the plateform after 2015. The current usage metrics is available 48-96 hours after online publication and is updated daily on week days.
Initial download of the metrics may take a while.