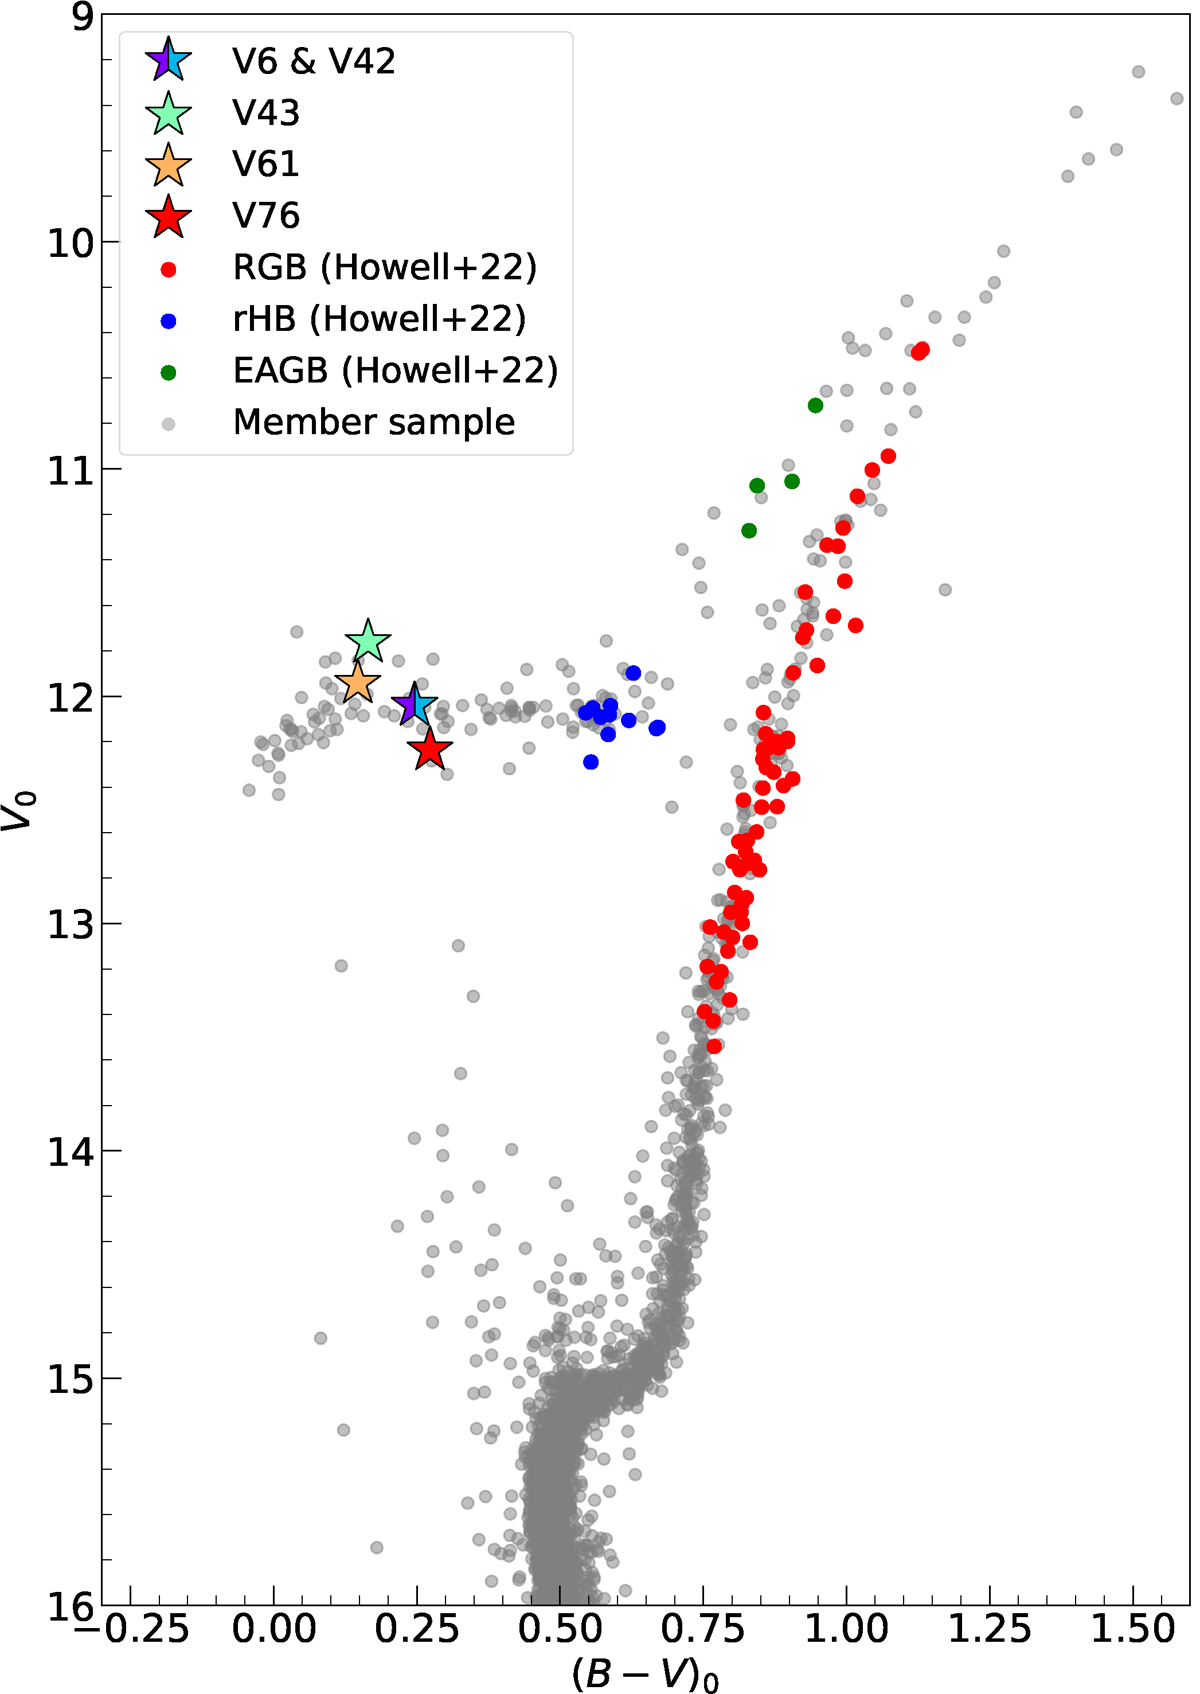
Fig. 2.
Download original image
Color-magnitude diagram of M4 in Johnson passbands using photometry from Stetson et al. (2014, 2019). The stars targeted by our study are identified by the colored star symbols; the stars in Howell et al. (2022) are shown as colored points. V6 & V42 overlap in the plot, which is indicated by the dual colored marker. The photometry has been corrected for dust using the Alonso-García et al. (2012) and Pancino et al. (2024) maps. The Gaia membership sample (gray) is from Vasiliev & Baumgardt (2021).
Current usage metrics show cumulative count of Article Views (full-text article views including HTML views, PDF and ePub downloads, according to the available data) and Abstracts Views on Vision4Press platform.
Data correspond to usage on the plateform after 2015. The current usage metrics is available 48-96 hours after online publication and is updated daily on week days.
Initial download of the metrics may take a while.