Open Access
Fig. 4.
Download original image
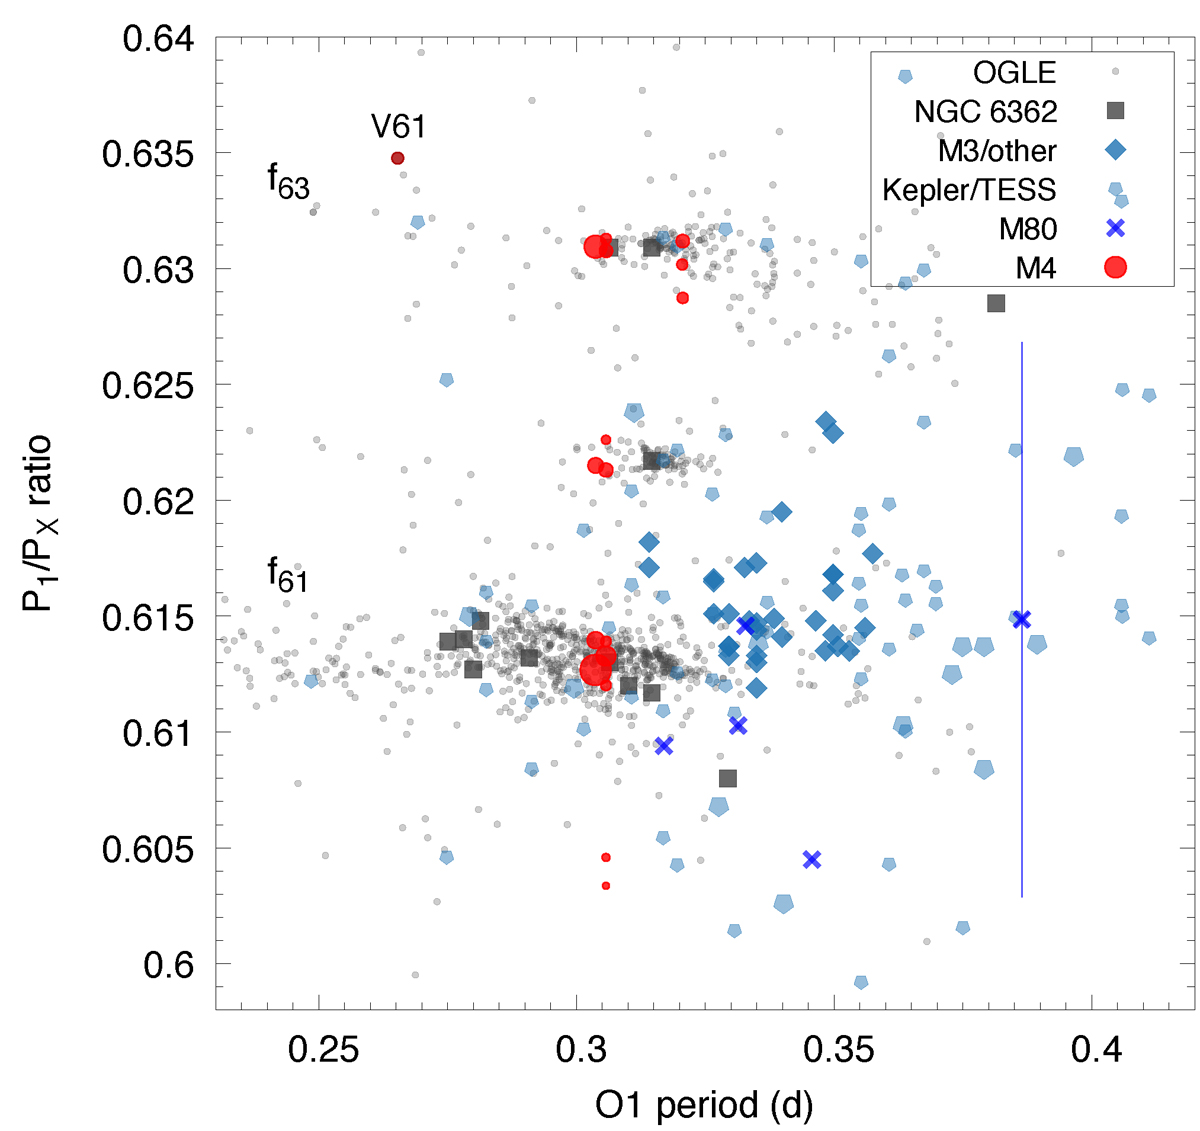
Petersen diagram of the f61-type modes. Here we plot signals detected in M4 (in red) over the existing literature data. The frequency peaks fall onto the main ridges discovered in the OGLE data. The positions of the f61 and f63 ridges are labeled.
Current usage metrics show cumulative count of Article Views (full-text article views including HTML views, PDF and ePub downloads, according to the available data) and Abstracts Views on Vision4Press platform.
Data correspond to usage on the plateform after 2015. The current usage metrics is available 48-96 hours after online publication and is updated daily on week days.
Initial download of the metrics may take a while.