Fig. 6.
Download original image
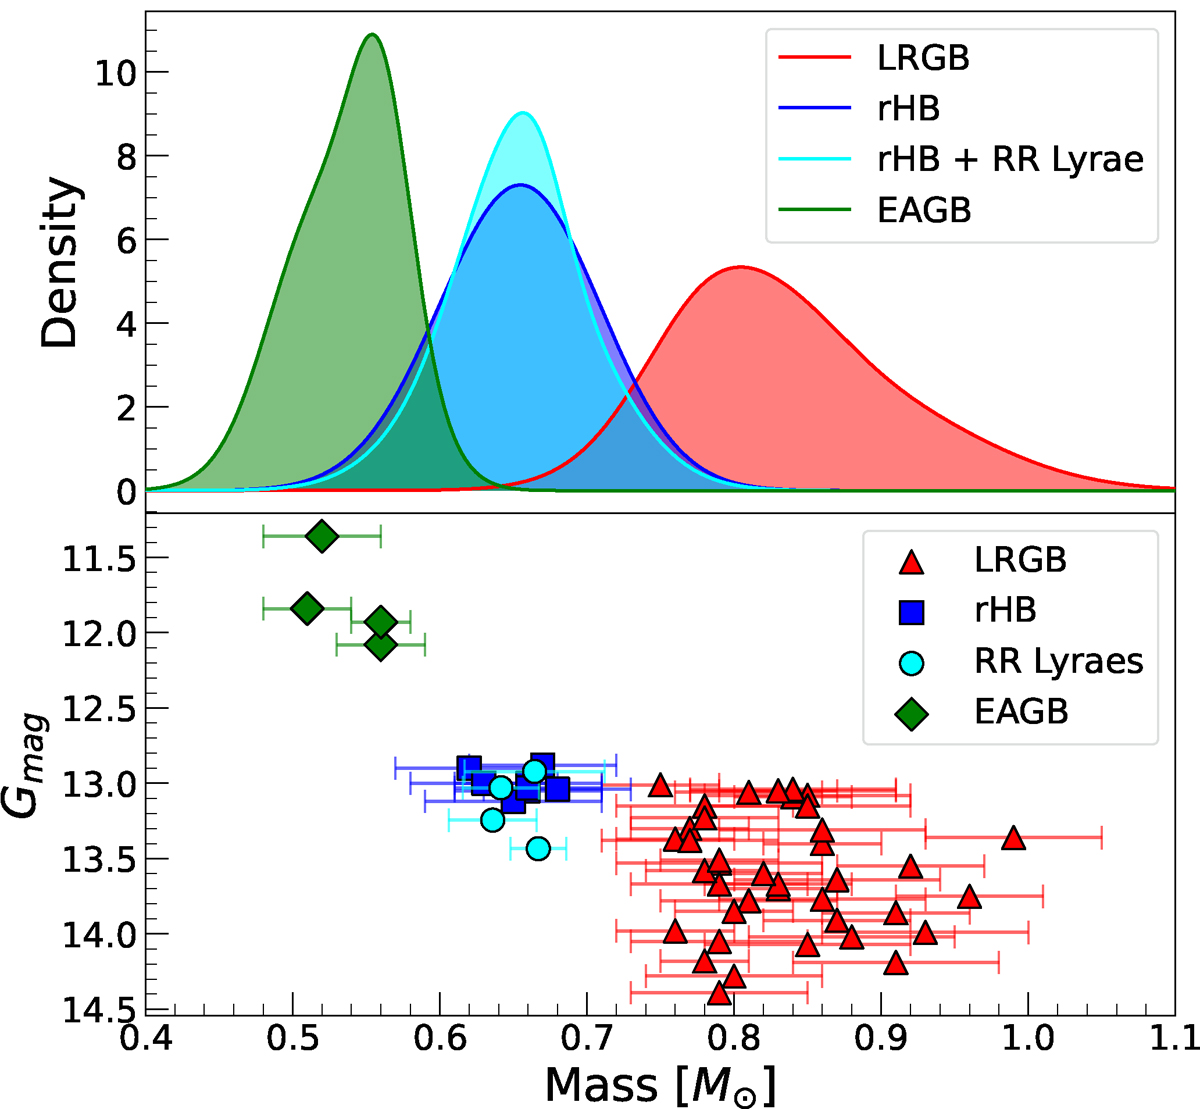
Top: Mass distributions (calculated as KDEs) for the M4 sample of red giants and RR Lyraes, separated into evolutionary phases. For the HB sample, we include a KDE consisting of just the rHB sample (blue), and a KDE that combines both the rHB and RR Lyrae samples (cyan). We note that the area of each KDE is normalized to one, and thus the heights of the distributions do not correspond to sample sizes. Mass outliers have been removed. Bottom: Individual masses for the red giant and RR Lyrae samples plotted against Gaia magnitude.
Current usage metrics show cumulative count of Article Views (full-text article views including HTML views, PDF and ePub downloads, according to the available data) and Abstracts Views on Vision4Press platform.
Data correspond to usage on the plateform after 2015. The current usage metrics is available 48-96 hours after online publication and is updated daily on week days.
Initial download of the metrics may take a while.