Fig. 1.
Download original image
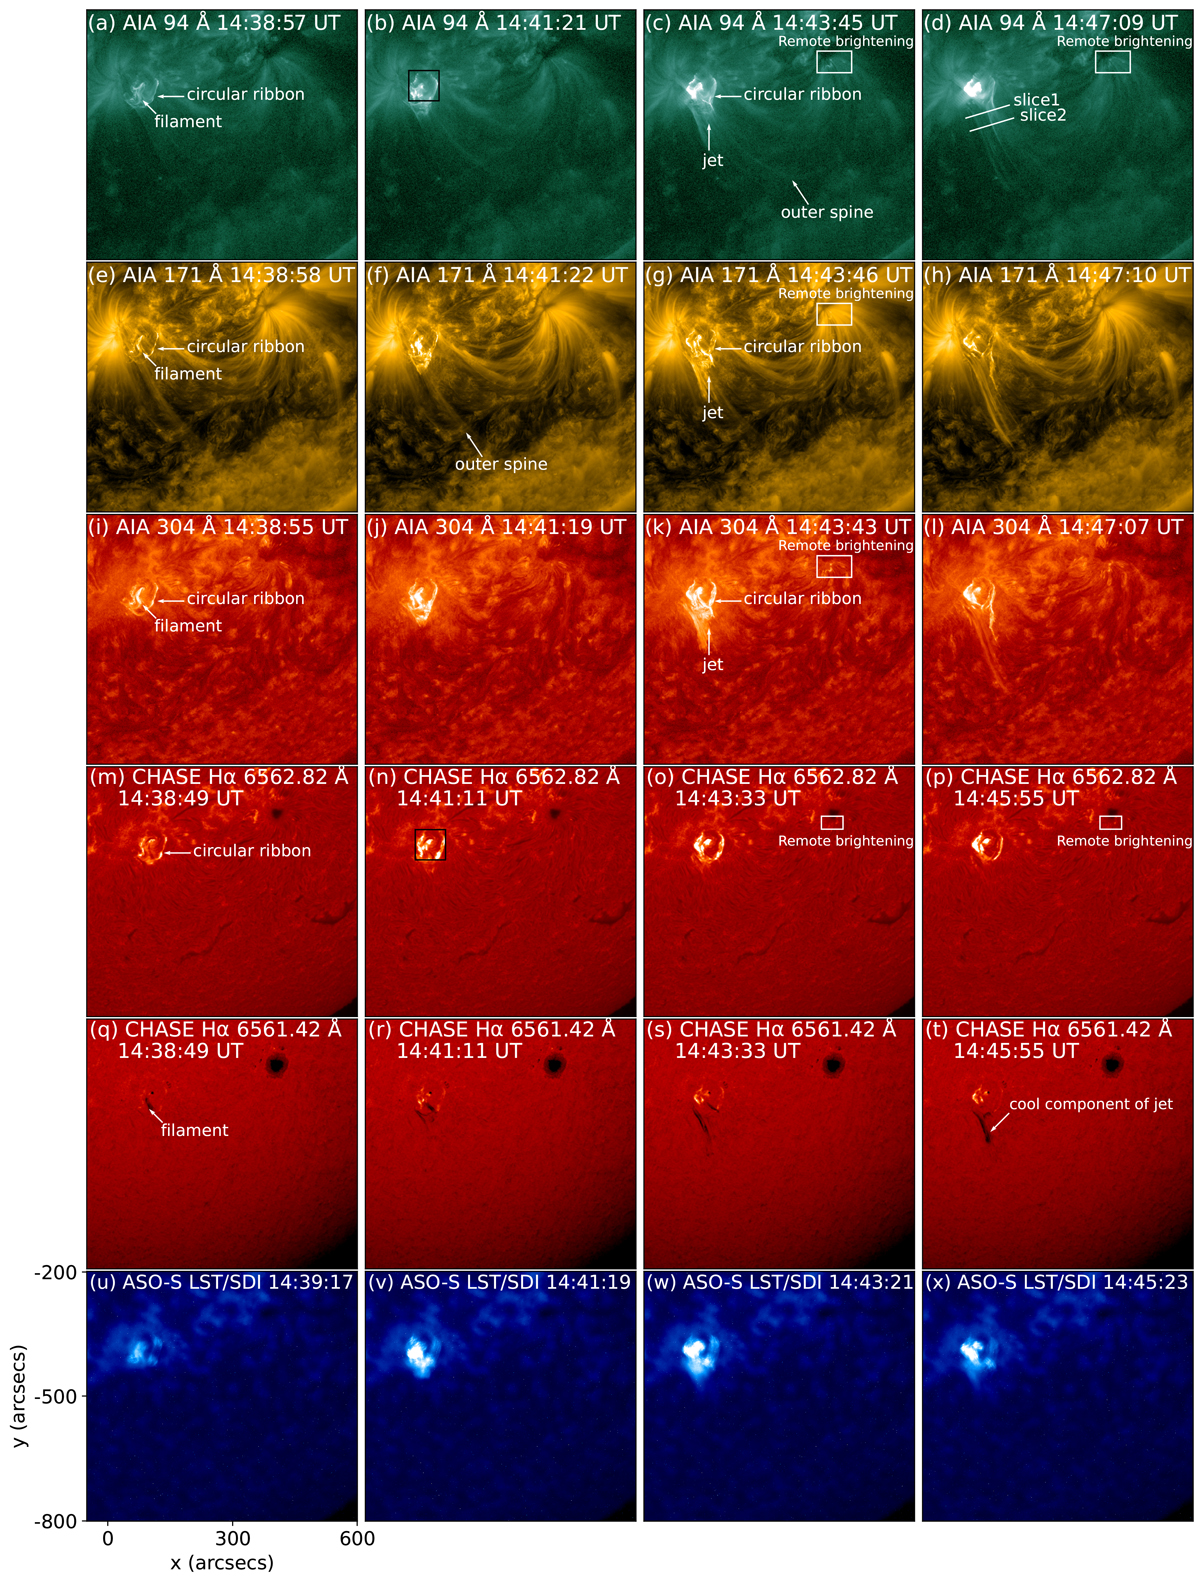
Overview of the circular ribbon flare. Panels (a)–(d) show images observed by SDO/AIA 94 Å; panels (e)–(h), images observed by SDO/AIA 171 Å; panels (i)–(l), images observed by SDO/AIA 304 Å; panels (m)–(p), CHASE Hα line core (6562.82 Å) images; panels (q)–(t), CHASE Hα blue-wing (6562.82 Å−1.4 Å) enhanced images; and panels (u)–(x), ASO-S LST/SDI Lyman–α waveband (1216 Å) images. From left to right, each column shows images at nearly the same time. The filament, circular ribbon, jet, outer spine, and remote brightening are indicated by white arrows and rectangles. The two white lines labeled slice1 and slice2 in panel d indicate the positions of the slices shown in Figures 9a and 9b.
Current usage metrics show cumulative count of Article Views (full-text article views including HTML views, PDF and ePub downloads, according to the available data) and Abstracts Views on Vision4Press platform.
Data correspond to usage on the plateform after 2015. The current usage metrics is available 48-96 hours after online publication and is updated daily on week days.
Initial download of the metrics may take a while.