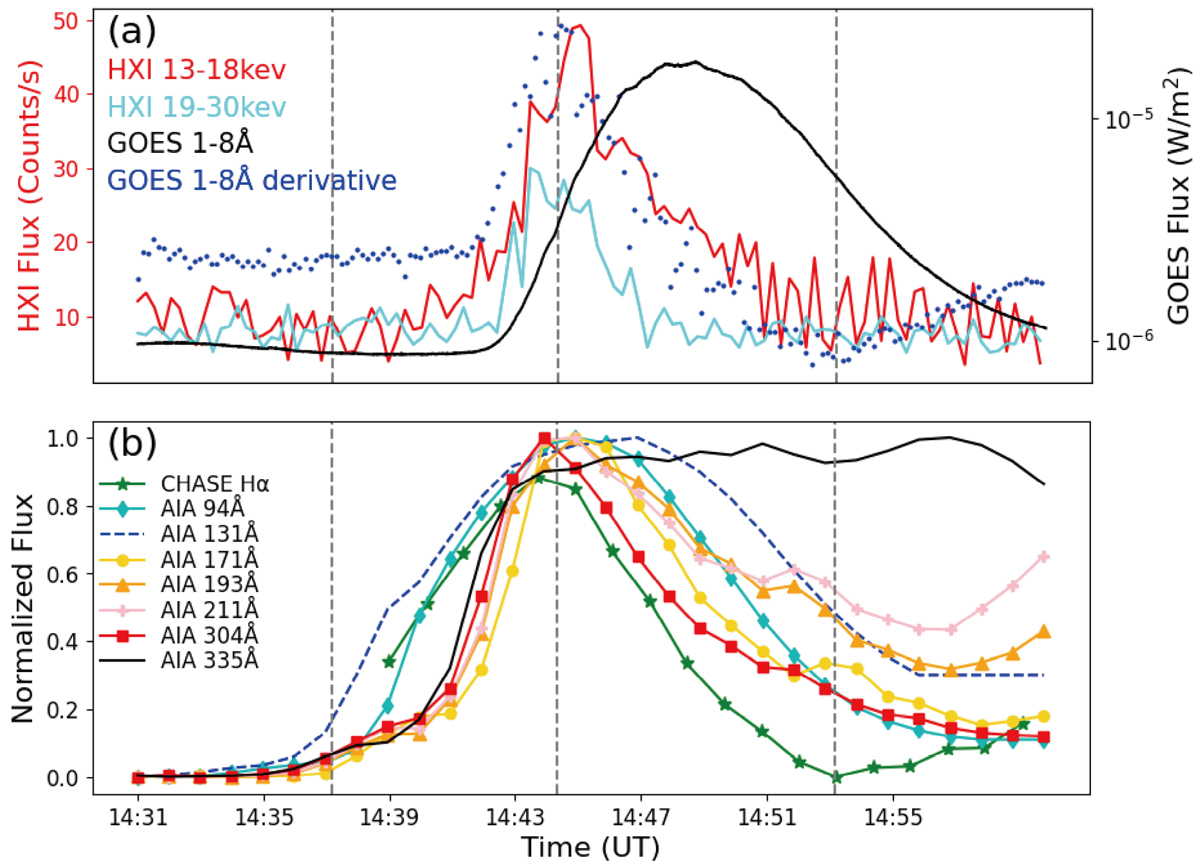
Fig. 2.
Download original image
Light curves of the M1.1 flare from 14:30 UT to 15:00 UT on 2023 May 25. Panel (a) shows GOES SXR fluxes at wavelengths of 1−8 Å (solid black line) and its derivative (dotted blue line), and HXI HXR count rates in the energy bands 13−18 keV (solid red line) and 19−30 keV (solid cyan line). Panel (b) shows normalized light curves of CHASE Hα waveband and AIA 94, 131, 171, 193, 211, 304, and 335 Å channels from the brightening region, as shown in the black box in Figure 1b.
Current usage metrics show cumulative count of Article Views (full-text article views including HTML views, PDF and ePub downloads, according to the available data) and Abstracts Views on Vision4Press platform.
Data correspond to usage on the plateform after 2015. The current usage metrics is available 48-96 hours after online publication and is updated daily on week days.
Initial download of the metrics may take a while.