Fig. 4.
Download original image
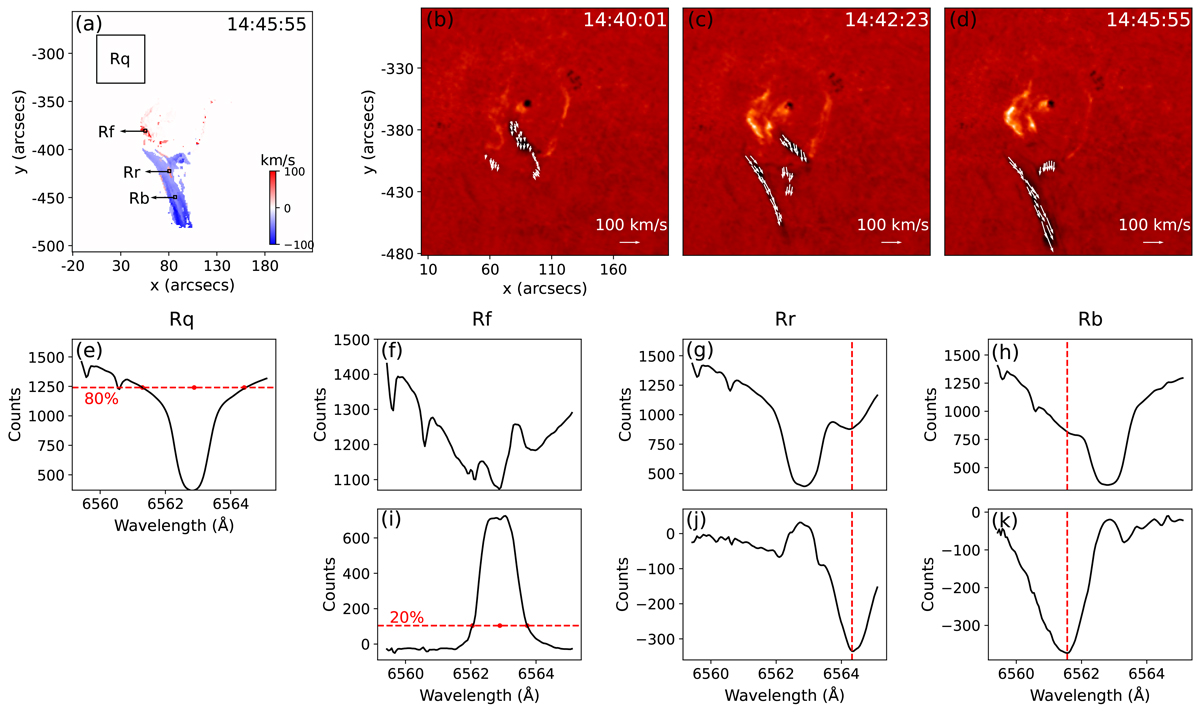
Line-of-sight (LOS) and plane-of-sky (POS) velocities of the flare and the cool component of the jet. Panel (a) shows the Doppler velocity diagram at 14:45:55 UT. Panels (b)–(d) show the temporal evolution of the POS velocity determined by FLCT. Panels (e)–(h) show Hα spectra observed by CHASE in the quiet region (Rq, the average spectral line of the black box in panel a), flare region (Rf), redshift (Rr), and blueshift (Rb) regions of the jet. Panels (i)–(k) show the net line profiles in Rf, Rr, and Rb. The dashed red lines indicate the 80% intensity of Rq, 20% intensity of the emission line of Rf, and the wavelengths corresponding to the intensity minimum of the red wing in Rr and the blue wing in Rb, respectively.
Current usage metrics show cumulative count of Article Views (full-text article views including HTML views, PDF and ePub downloads, according to the available data) and Abstracts Views on Vision4Press platform.
Data correspond to usage on the plateform after 2015. The current usage metrics is available 48-96 hours after online publication and is updated daily on week days.
Initial download of the metrics may take a while.