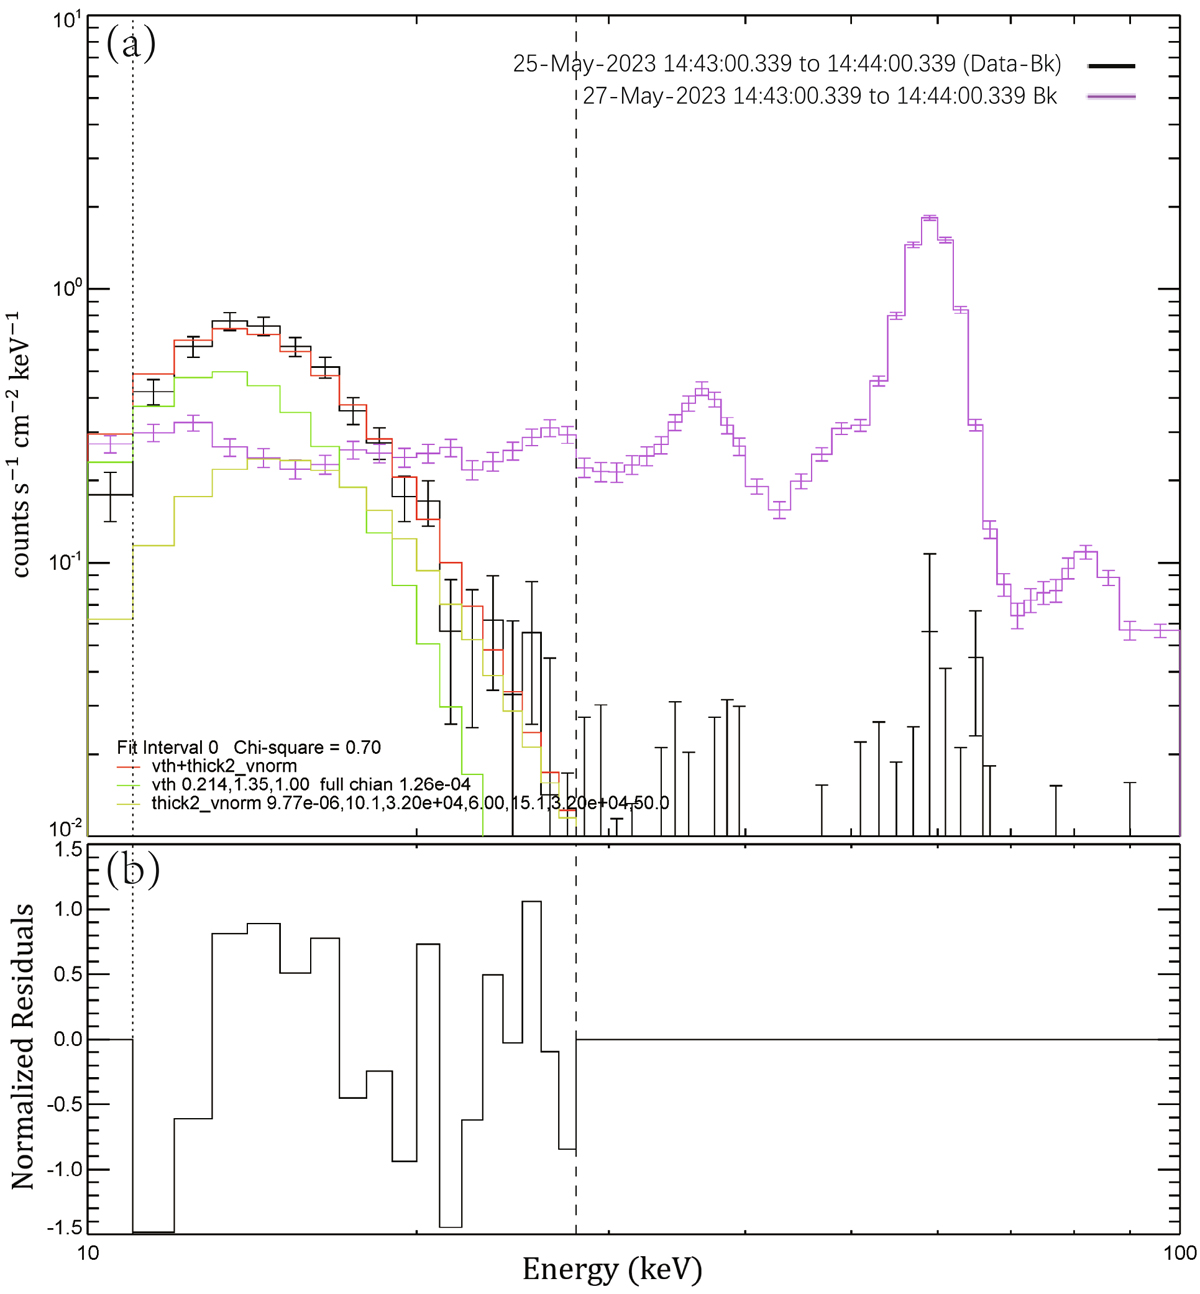
Fig. 6.
Download original image
Energy spectrum analysis from HXI. The upper panel shows the HXI hard X-ray spectrum during 14:43:00 UT–14:44:00 UT (black line) after removing the background, with the background energy spectrum shown in purple. The fitted thermal (vth), nonthermal (thick2) components, and their sum (vth+thick2) are indicated by green, yellow, and red lines, respectively. The lower panel shows the normalized residuals.
Current usage metrics show cumulative count of Article Views (full-text article views including HTML views, PDF and ePub downloads, according to the available data) and Abstracts Views on Vision4Press platform.
Data correspond to usage on the plateform after 2015. The current usage metrics is available 48-96 hours after online publication and is updated daily on week days.
Initial download of the metrics may take a while.