Fig. 7.
Download original image
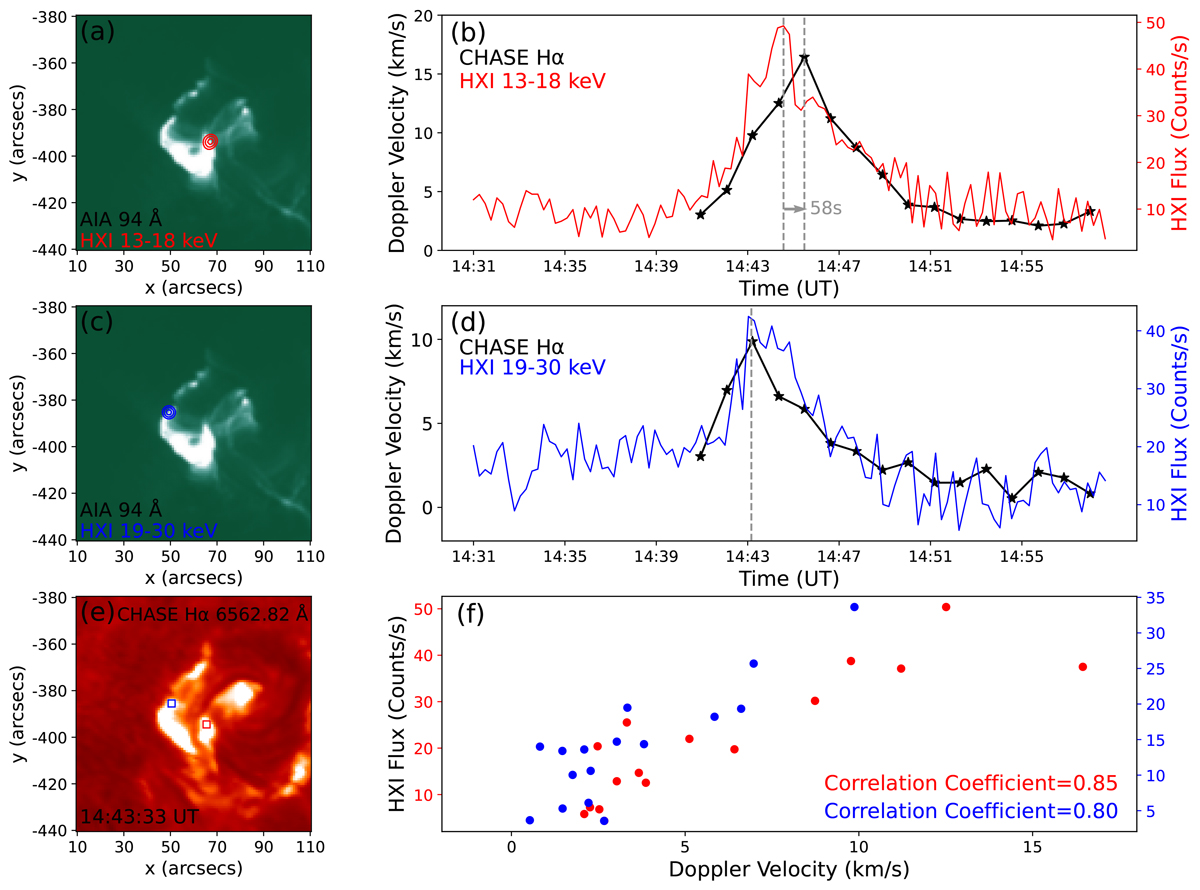
Comparison of HXI flux and CHASE Doppler velocity. Panel (a) shows an AIA 94 Å map during the solar flare, with HXR 13−18 keV emissions at 90%, 70%, and 50% levels indicated by red contours. Panel (b) shows the HXI 13−18 keV flux (red) and CHASE Hα Doppler velocity (black) for the region of the HXR 13−18 keV emission source (red rectangle in panel e), with gray dotted lines marking their peak times. Panels (c)–(d) are similar to panels a–b, but corresponding to the HXR 19−30 keV flux (blue) and Doppler velocity (black) of its source (blue rectangle in panel e). Panel (e) shows the CHASE Hα line-core image at 14:43:33 UT, with the Doppler velocity calculation areas from panels b and d indicated by the red and blue boxes, respectively. Panel (f) shows the scatterplots of Doppler velocities versus the HXR 13−18 keV (red) and 19−30 keV (blue) fluxes, with the Pearson correlation coefficients labeled.
Current usage metrics show cumulative count of Article Views (full-text article views including HTML views, PDF and ePub downloads, according to the available data) and Abstracts Views on Vision4Press platform.
Data correspond to usage on the plateform after 2015. The current usage metrics is available 48-96 hours after online publication and is updated daily on week days.
Initial download of the metrics may take a while.