Fig. 8.
Download original image
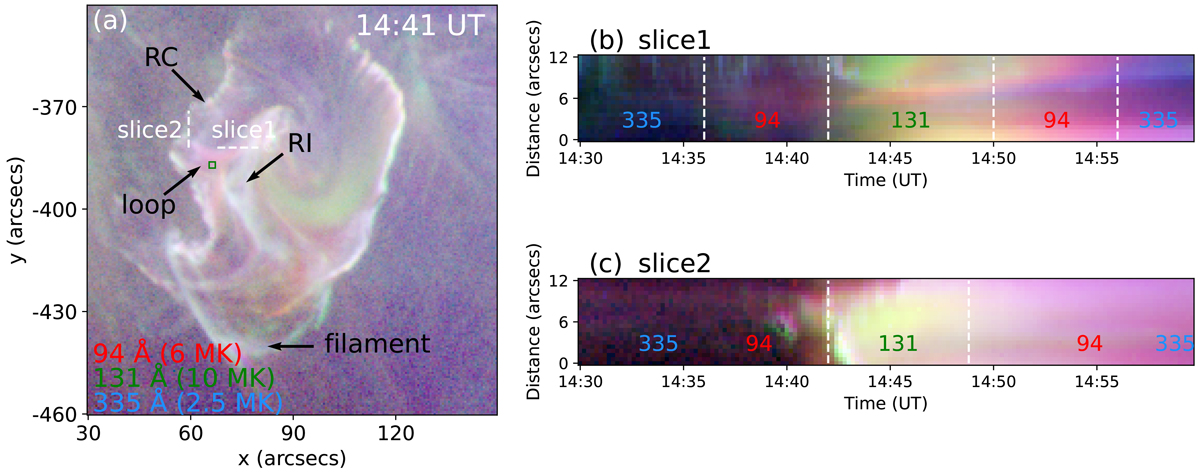
Panel (a) shows a tricolor AIA image with channels in 94 Å (red), 131 Å (green), and 335 Å (blue) at 14:41 UT. The filament, flare loop, circular ribbon (RC), and inner-spine ribbon (RI) are indicated by black arrows. Panels (b)–(c) show distance–time diagrams constructed from slice1 and slice2 in panel a. The changing colors illustrate a heating and cooling process. The borders between dominated AIA passbands are indicated by white dashed lines.
Current usage metrics show cumulative count of Article Views (full-text article views including HTML views, PDF and ePub downloads, according to the available data) and Abstracts Views on Vision4Press platform.
Data correspond to usage on the plateform after 2015. The current usage metrics is available 48-96 hours after online publication and is updated daily on week days.
Initial download of the metrics may take a while.