Open Access
Fig. 11
Download original image
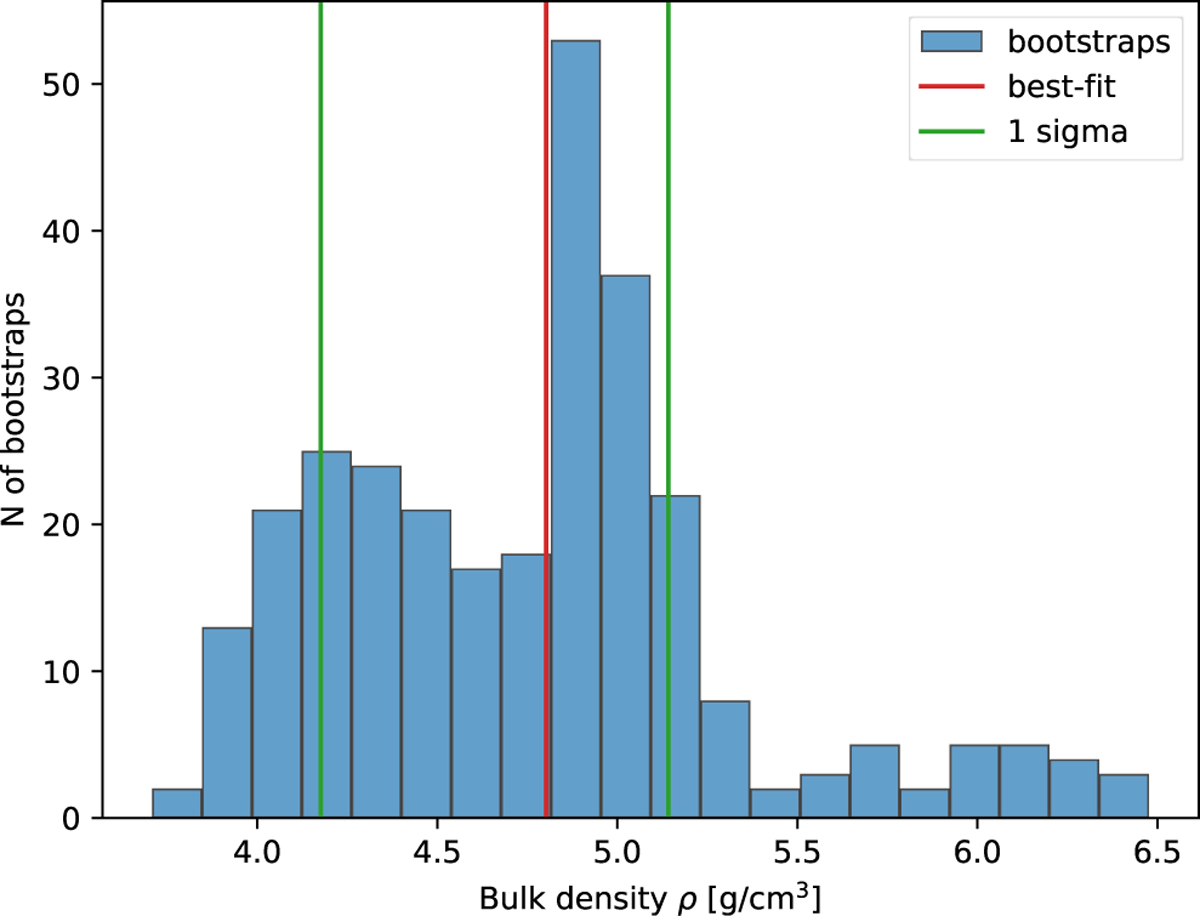
Density estimates for WO107. The blue histogram shows the distribution of densities calculated from bootstraps. The red line shows the density estimate from the best-fit asteroid model for the full data, and the green lines show the 1σ uncertainty range estimated from the bootstrapped data.
Current usage metrics show cumulative count of Article Views (full-text article views including HTML views, PDF and ePub downloads, according to the available data) and Abstracts Views on Vision4Press platform.
Data correspond to usage on the plateform after 2015. The current usage metrics is available 48-96 hours after online publication and is updated daily on week days.
Initial download of the metrics may take a while.