Open Access
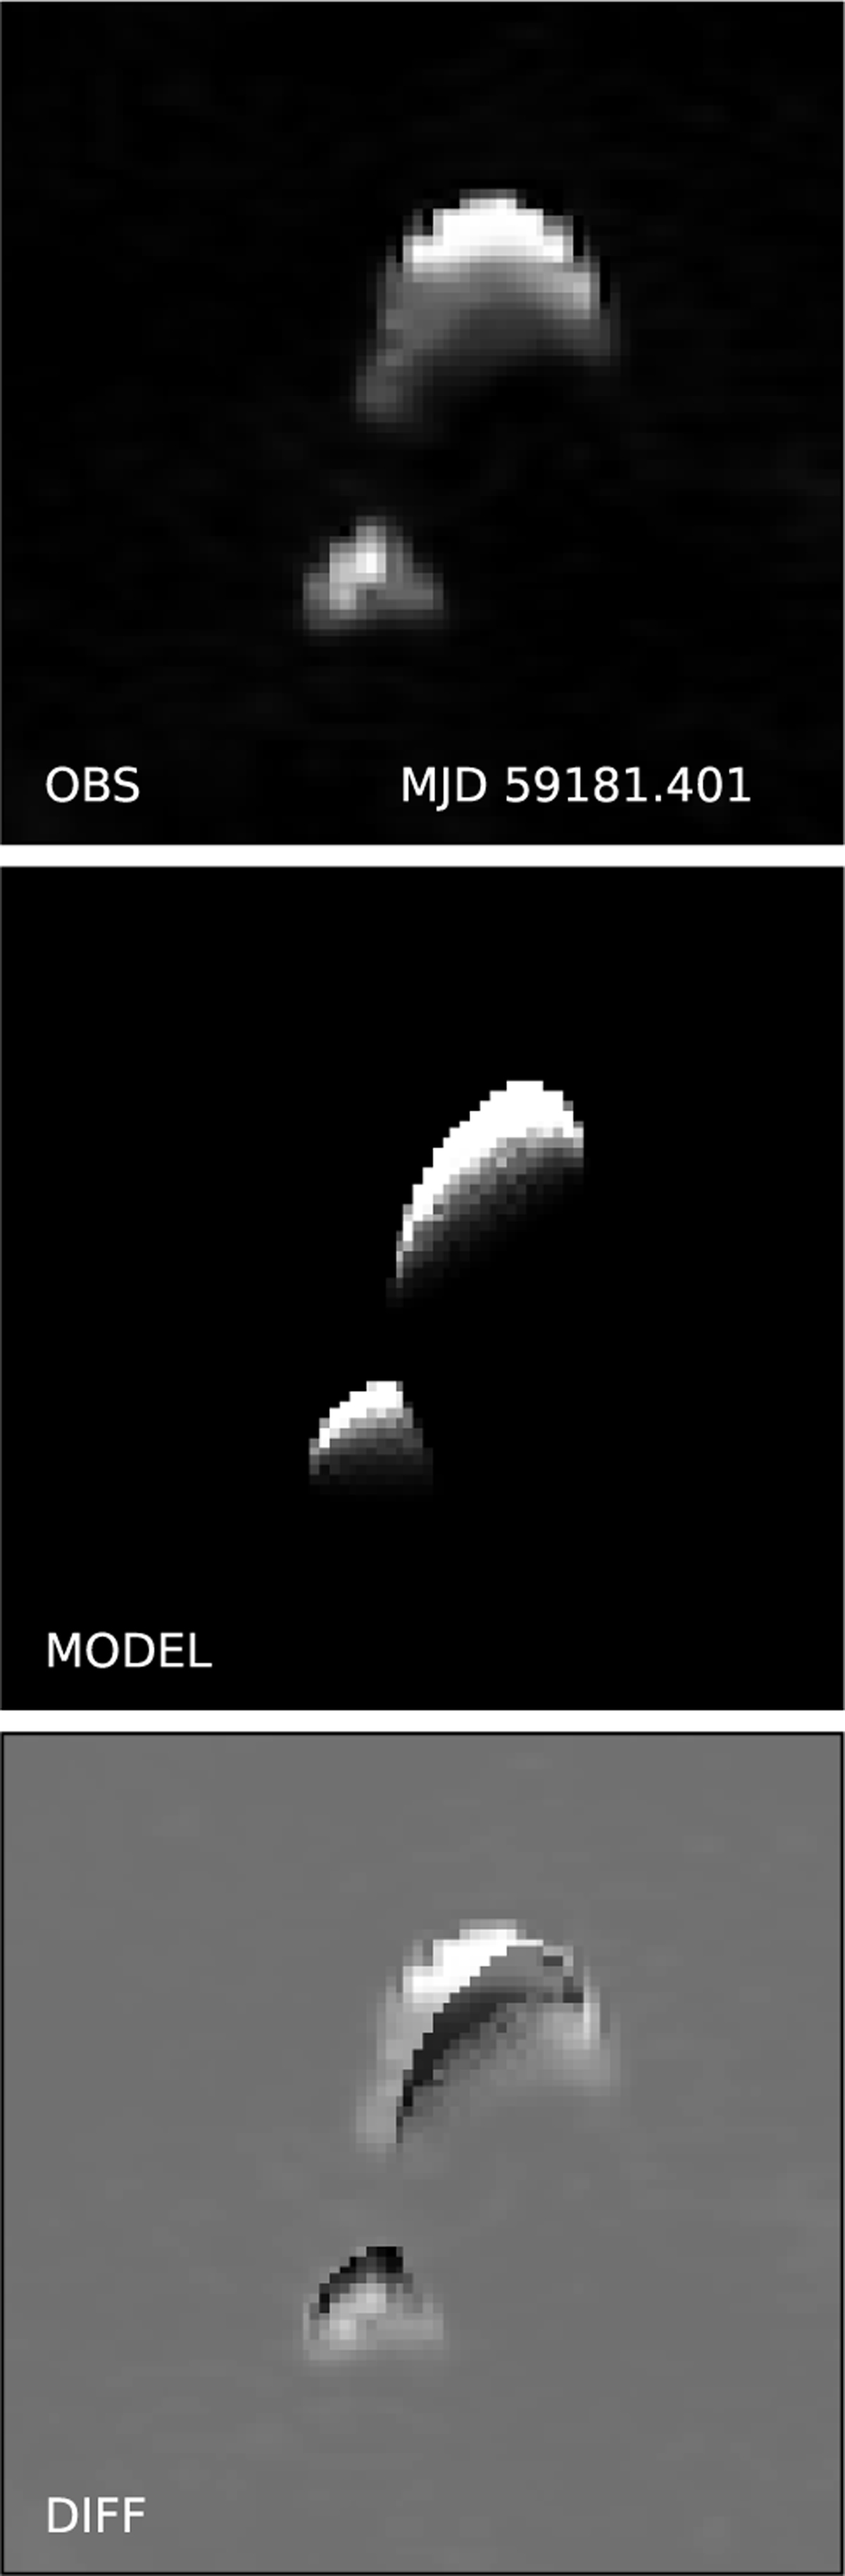
Fig. 8
Download original image
Sample radar image. The first image represents the observed data, the second image shows the modeled data, and the third image illustrates the difference between them. For a perfect agreement between the images, the pixels of the third image would be gray, but for the worse agreement, they are split into separate shapes.
Current usage metrics show cumulative count of Article Views (full-text article views including HTML views, PDF and ePub downloads, according to the available data) and Abstracts Views on Vision4Press platform.
Data correspond to usage on the plateform after 2015. The current usage metrics is available 48-96 hours after online publication and is updated daily on week days.
Initial download of the metrics may take a while.