Fig. 3
Download original image
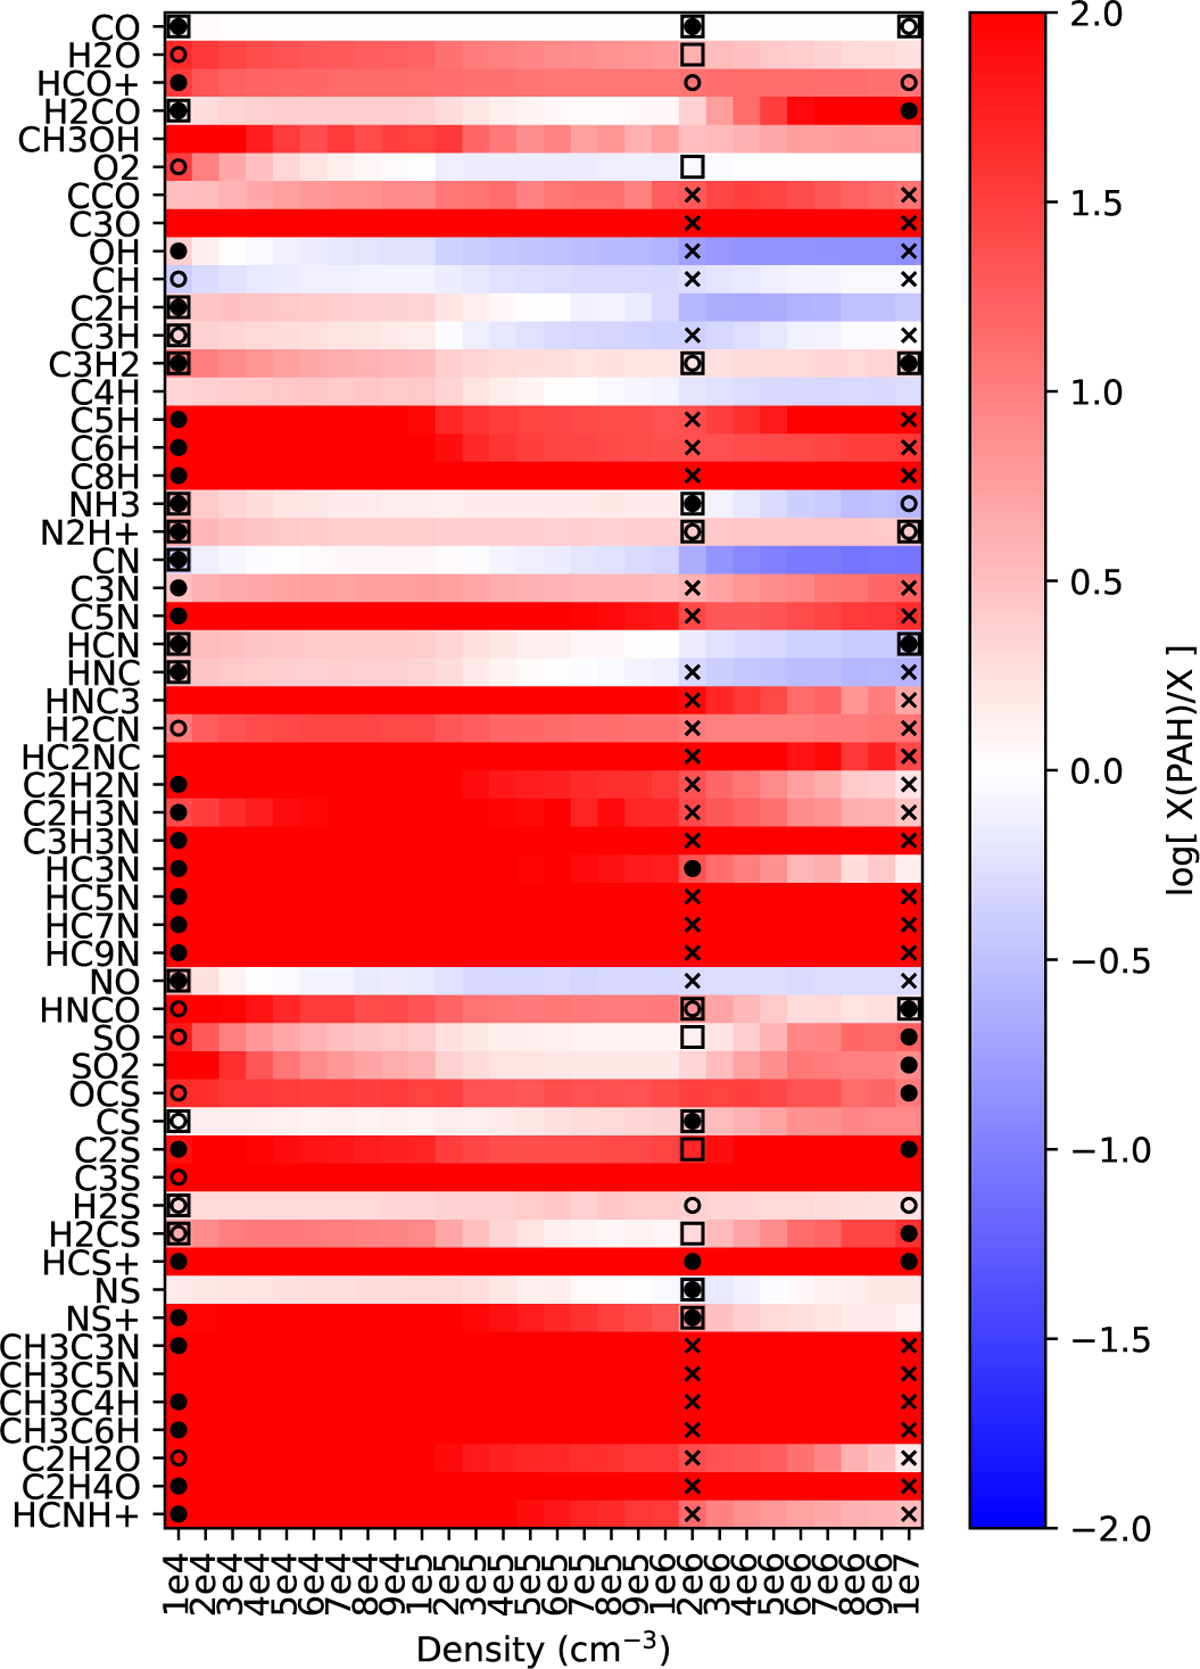
Abundance ratios (log[X(PAH)/X]) between the models with and without PAHs as a function of density. The ratios were calculated at the best-fit ages estimated through Eq. (B.1). The filled points, empty points, and crosses indicate the species in TMC-1 CP and L1544 that prefer the model with PAHs, prefer the model without PAHs, and have a non-detection in observations, respectively. The unfilled squares mark the species that are preferred by the models with and without PAHs. All the points with symbols except those with crosses indicate that the modeled abundances are within one order of magnitude of the observed ones.
Current usage metrics show cumulative count of Article Views (full-text article views including HTML views, PDF and ePub downloads, according to the available data) and Abstracts Views on Vision4Press platform.
Data correspond to usage on the plateform after 2015. The current usage metrics is available 48-96 hours after online publication and is updated daily on week days.
Initial download of the metrics may take a while.