Fig. 1.

Download original image
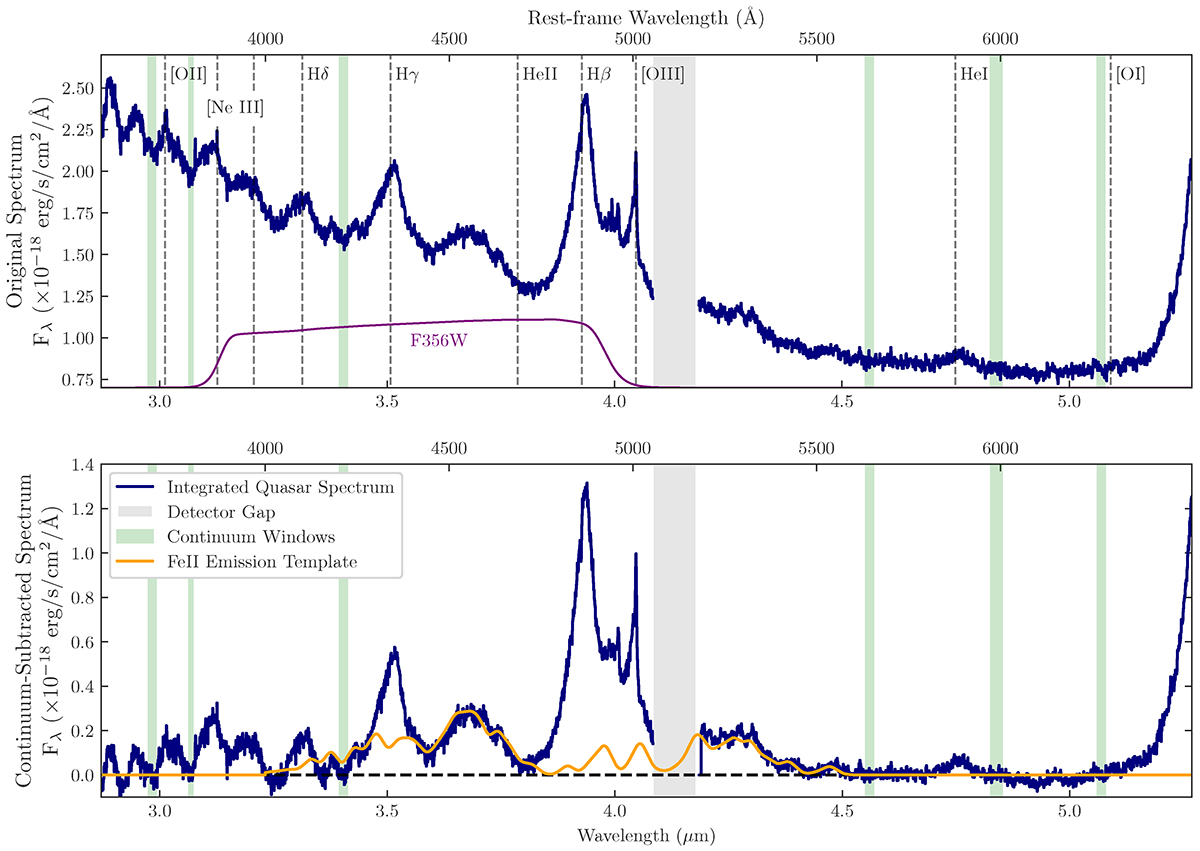
Integrated spectrum of J1120+0641 from the IFU data (blue). The spectrum is integrated over an aperture of radius ![]() centred on the peak of the quasar emission. An aperture flux correction of 1.23× has been applied. The top panel shows the spectrum integrated from the original background-subtracted data cube. The bottom panel shows the spectrum integrated from the continuum-subtracted data cube. The green shaded regions show the continuum windows used to model and subtract the continuum emission (Section 2.1.3). At this redshift, z = 7.08, the [O III] λλ4959,5007 doublet falls just blueward of the detector gap (grey shaded region), and the broad Hα line falls just off the red edge of detector. The purple curve shows the wavelength coverage of the NIRCam F356W filter used in the EIGER images. The yellow curve shows the Park et al. (2022) iron emission template, with redshift and normalisation taken from our best spectral model fit (Section 2.1.6).
centred on the peak of the quasar emission. An aperture flux correction of 1.23× has been applied. The top panel shows the spectrum integrated from the original background-subtracted data cube. The bottom panel shows the spectrum integrated from the continuum-subtracted data cube. The green shaded regions show the continuum windows used to model and subtract the continuum emission (Section 2.1.3). At this redshift, z = 7.08, the [O III] λλ4959,5007 doublet falls just blueward of the detector gap (grey shaded region), and the broad Hα line falls just off the red edge of detector. The purple curve shows the wavelength coverage of the NIRCam F356W filter used in the EIGER images. The yellow curve shows the Park et al. (2022) iron emission template, with redshift and normalisation taken from our best spectral model fit (Section 2.1.6).
Current usage metrics show cumulative count of Article Views (full-text article views including HTML views, PDF and ePub downloads, according to the available data) and Abstracts Views on Vision4Press platform.
Data correspond to usage on the plateform after 2015. The current usage metrics is available 48-96 hours after online publication and is updated daily on week days.
Initial download of the metrics may take a while.


