Fig. B.1.
Download original image
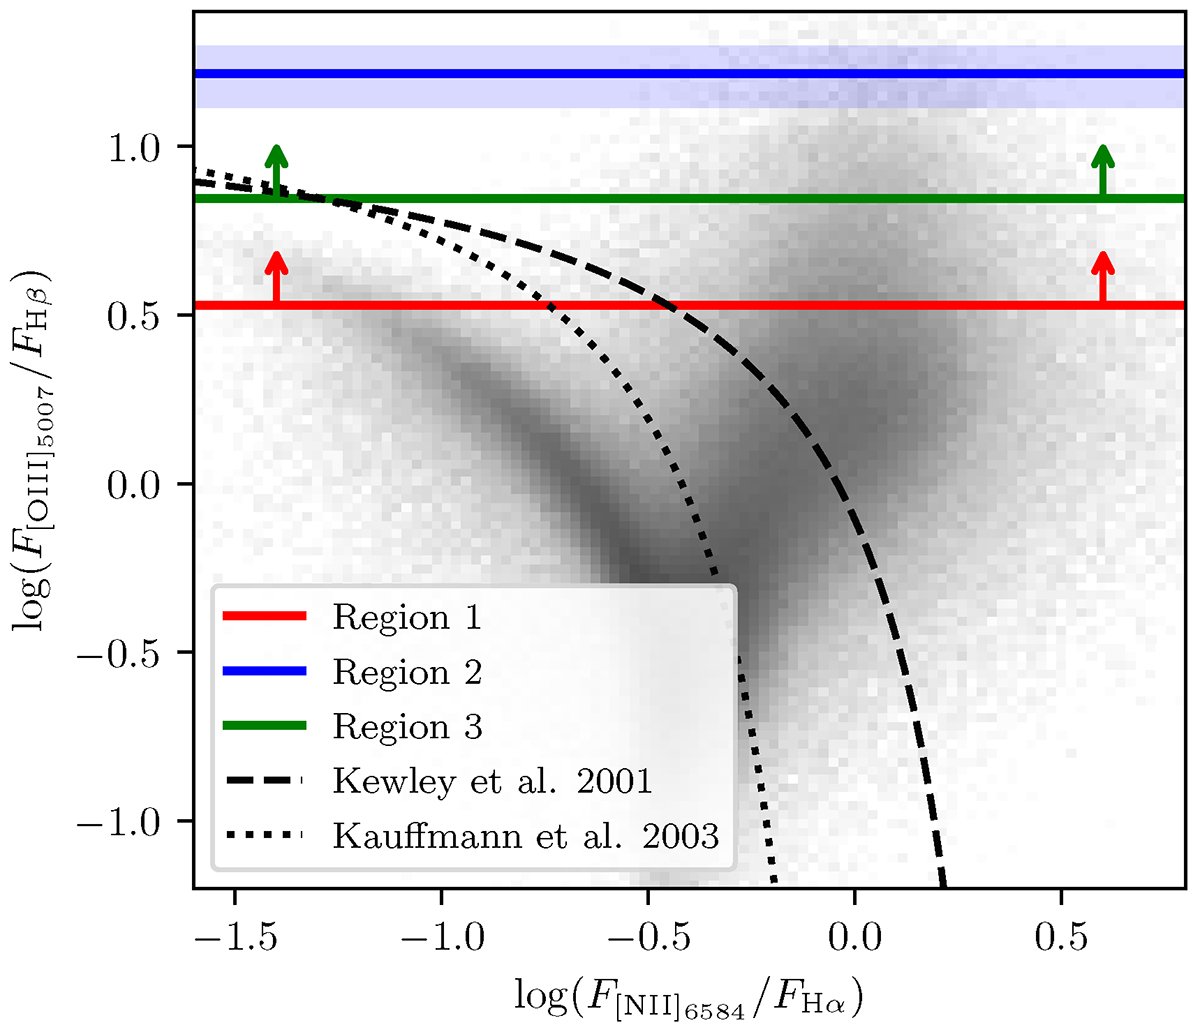
BPT diagnostic diagram showing the [O III] λ5007/Hβ flux ratio measured for the companion galaxy (Region 2), and the lower limits for the host galaxy (Region 1) and Region 3, as listed in Table 1. For reference, we show the Kauffmann et al. (2003) (black dotted) and Kewley et al. (2001) (black dashed) curves which attempt to differentiate between galaxies primarily ionised by star formation (lower left) and AGN (upper right) at low-z. We also show local sources from the SDSS (Abazajian et al. 2009, 2D histogram) for comparison.
Current usage metrics show cumulative count of Article Views (full-text article views including HTML views, PDF and ePub downloads, according to the available data) and Abstracts Views on Vision4Press platform.
Data correspond to usage on the plateform after 2015. The current usage metrics is available 48-96 hours after online publication and is updated daily on week days.
Initial download of the metrics may take a while.