Fig. 2.
Download original image
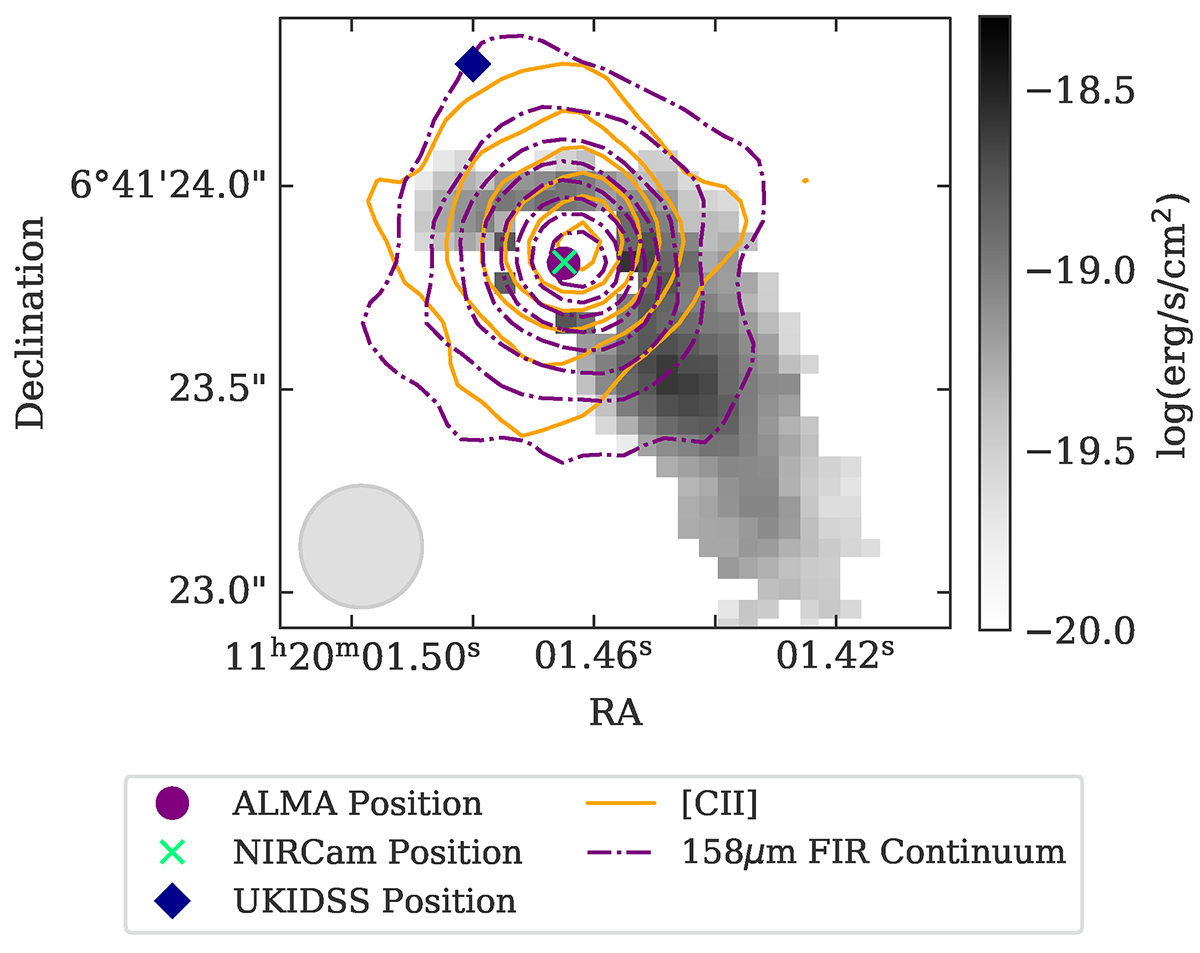
Quasar-subtracted [O III] λ5007 emission map from the NIRSpec IFU (grey image) compared to the [C II] 158 μm emission map (orange contours) and the rest-frame 158 μm FIR continuum emission map (purple contours) from ALMA (see Section 5.2). The [C II] 158 μm contours are linearly spaced from 5σ to 26σ, where σ = 16 μJy. The FIR continuum contours are linearly spaced from 5σ to 42σ, where σ = 7 μJy/beam. The grey circle depicts the approximate PSF of the ALMA observations, with beam diameter ![]() . The green cross marks the peak of the quasar emission from the NIRSpec IFU data that has been astrometrically aligned to the NIRCam imaging, which is aligned to Gaia DR2 (Yue et al. 2024). The purple circle marks the peak of the 158 μm FIR continuum emission reported by Venemans et al. (2017). The blue diamond marks the original quasar position from UKIDSS quoted by Mortlock et al. (2011).
. The green cross marks the peak of the quasar emission from the NIRSpec IFU data that has been astrometrically aligned to the NIRCam imaging, which is aligned to Gaia DR2 (Yue et al. 2024). The purple circle marks the peak of the 158 μm FIR continuum emission reported by Venemans et al. (2017). The blue diamond marks the original quasar position from UKIDSS quoted by Mortlock et al. (2011).
Current usage metrics show cumulative count of Article Views (full-text article views including HTML views, PDF and ePub downloads, according to the available data) and Abstracts Views on Vision4Press platform.
Data correspond to usage on the plateform after 2015. The current usage metrics is available 48-96 hours after online publication and is updated daily on week days.
Initial download of the metrics may take a while.