Fig. 3.
Download original image
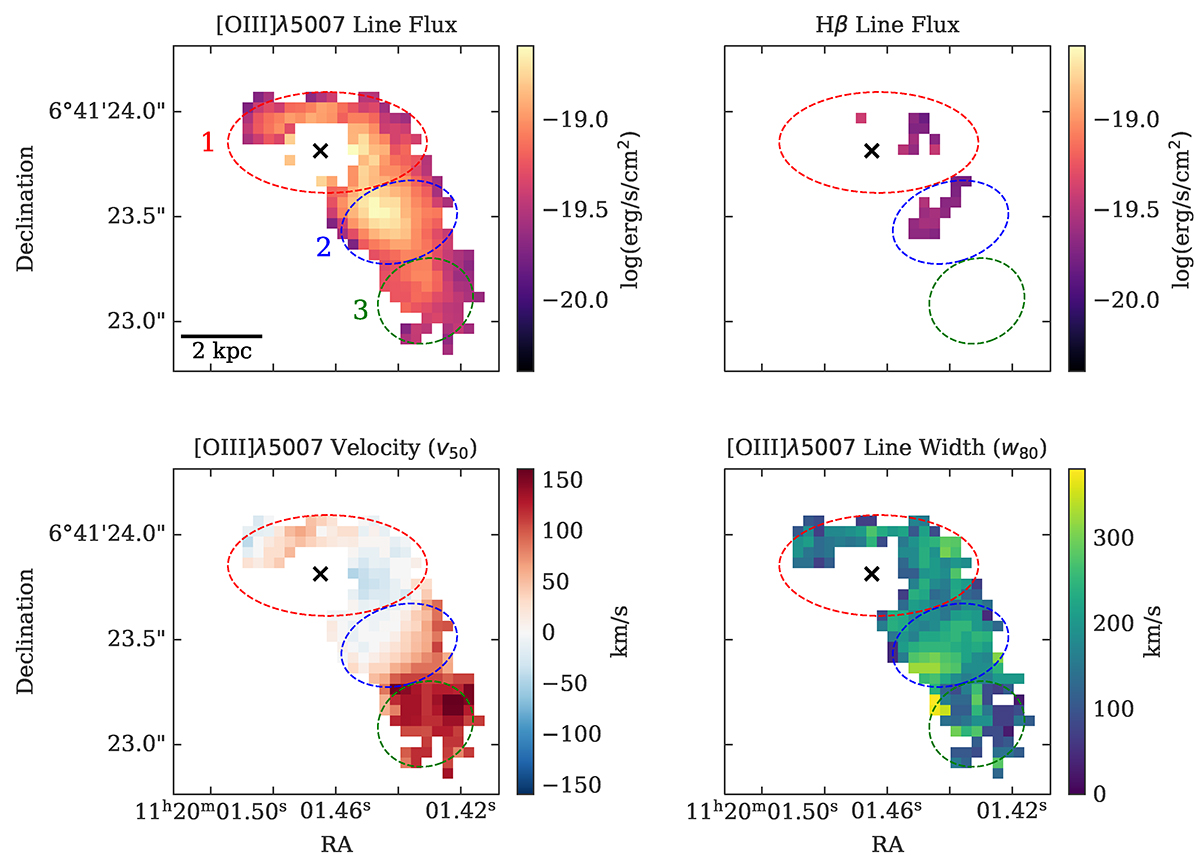
Emission-line regions surrounding J1120+0641 showing flux and kinematic maps after the subtraction of the quasar emission. The top-left and -right panels show the flux of the [O III] λ5007 and Hβ lines, respectively, from the integrated flux of the fitted Gaussian in each spaxel. The bottom-left and -right panels show our [O III] λ5007 kinematic maps, depicting the non-parametric central velocity of the line (v50) relative to the quasar host redshift of z = 7.0804 ± 0.0028 and the line width (w80), respectively. Three emission-line regions are highlighted by coloured ellipses, and the crosses show the location of the quasar.
Current usage metrics show cumulative count of Article Views (full-text article views including HTML views, PDF and ePub downloads, according to the available data) and Abstracts Views on Vision4Press platform.
Data correspond to usage on the plateform after 2015. The current usage metrics is available 48-96 hours after online publication and is updated daily on week days.
Initial download of the metrics may take a while.