Fig. 4.
Download original image
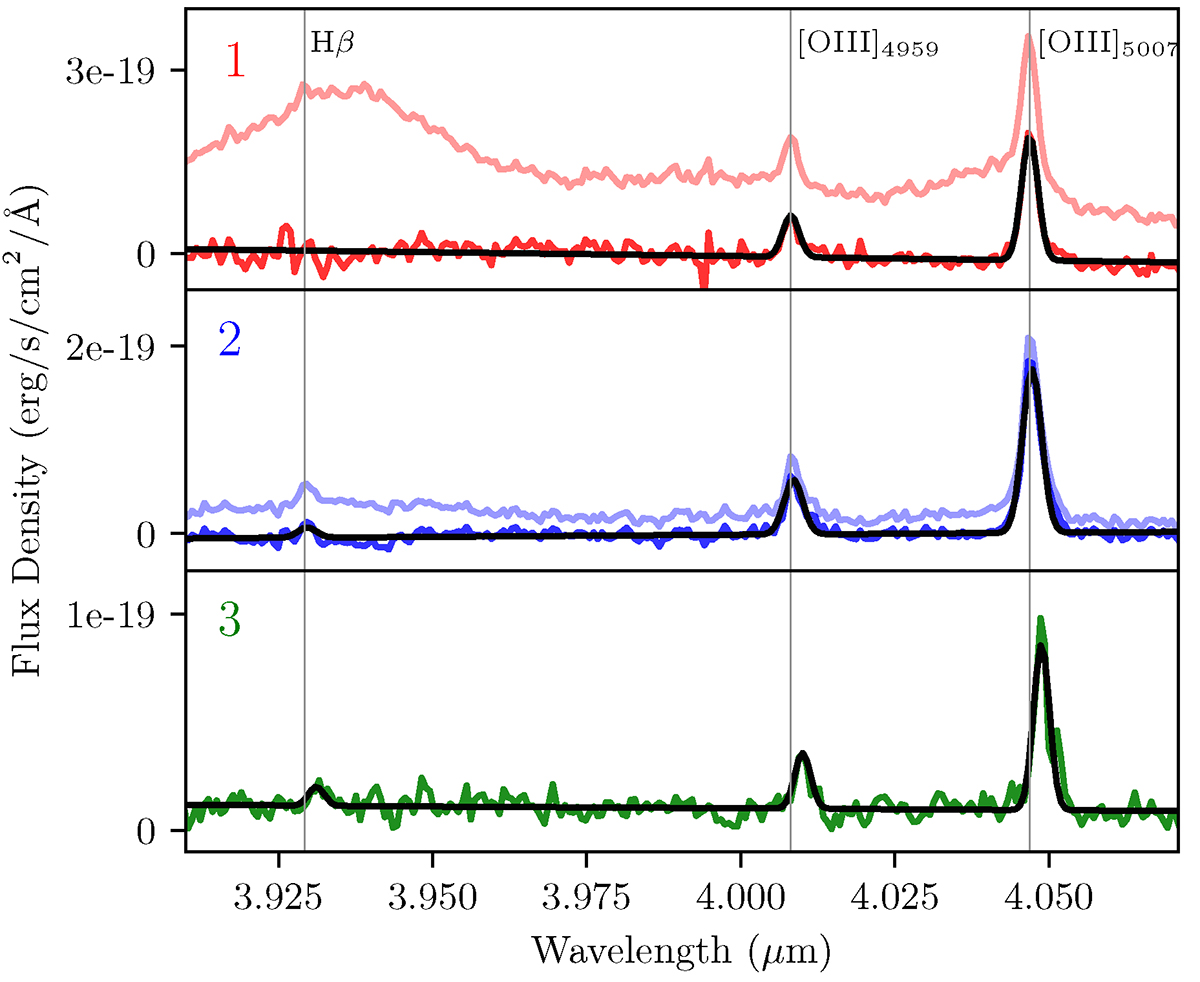
Quasar-subtracted spectra integrated over the three spatial regions shown in Figure 3 (opaque coloured lines) along with our best-fit Gaussian models for the Hβ and [O III] λλ4959,5007 emission lines (black). The analogous spectra from the non-quasar-subtracted cube are also plotted for comparison (transparent coloured lines), showing the necessity of quasar subtraction to accurately measure the emission from Regions 1 and 2. All spectra have been continuum subtracted. The vertical lines mark the location of the Hβ and [O III] λλ4959,5007 lines at the redshift of the quasar host galaxy, Region 1, as measured from the fit to this spectrum, z = 7.0804 ± 0.0028. For the host Region 1, we exclude the central 5 × 5 pixels surrounding the quasar peak as well as nearby spaxels with [O III] λ5007 velocity offset > 300 km/s, as these are highly corrupted by the quasar subtraction and introduce significant noise and artefacts. This means that we slightly underestimate the total flux in this region; however, the fluxes are significantly more reliable than if these most corrupted spaxels were included.
Current usage metrics show cumulative count of Article Views (full-text article views including HTML views, PDF and ePub downloads, according to the available data) and Abstracts Views on Vision4Press platform.
Data correspond to usage on the plateform after 2015. The current usage metrics is available 48-96 hours after online publication and is updated daily on week days.
Initial download of the metrics may take a while.