Fig. 5.
Download original image
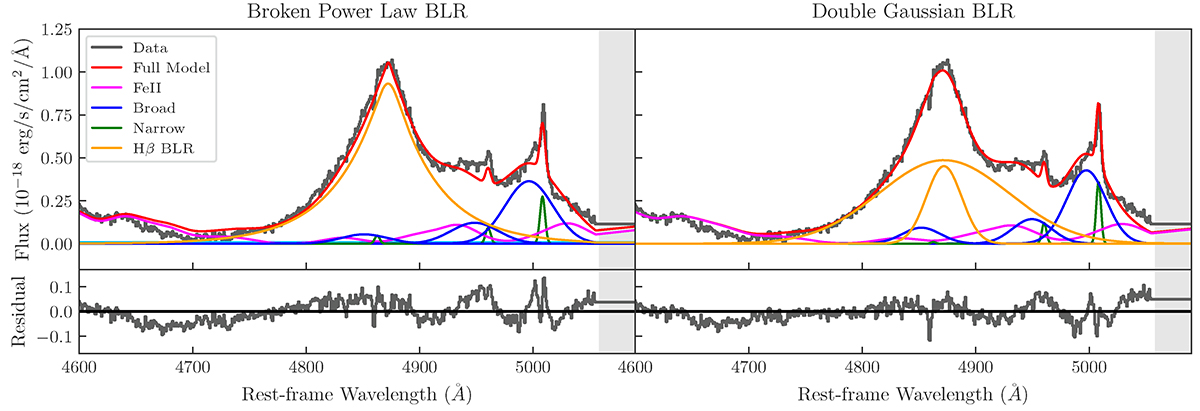
Integrated quasar spectrum for J1120+0641 (black) showing the region around Hβ. The spectrum is integrated over a radius of ![]() , and no correction for the loss of flux in this aperture has been applied (although this is accounted for in the related calculations). The best model fit (red) is shown alongside the narrow-line components (green), the broader outflow components (blue), the iron emission template (pink), and the model for the BLR (orange). The lower panels show the residual of the model fit. Both models assume the iron emission follows the Park et al. (2022) template. The left panels show a model assuming that the Hβ BLR is described by a BPL model. The right panels show a model assuming that the Hβ BLR is described by two Gaussian profiles (the DG model). The shaded grey regions show where the detector gap falls, resulting in no coverage of those wavelengths.
, and no correction for the loss of flux in this aperture has been applied (although this is accounted for in the related calculations). The best model fit (red) is shown alongside the narrow-line components (green), the broader outflow components (blue), the iron emission template (pink), and the model for the BLR (orange). The lower panels show the residual of the model fit. Both models assume the iron emission follows the Park et al. (2022) template. The left panels show a model assuming that the Hβ BLR is described by a BPL model. The right panels show a model assuming that the Hβ BLR is described by two Gaussian profiles (the DG model). The shaded grey regions show where the detector gap falls, resulting in no coverage of those wavelengths.
Current usage metrics show cumulative count of Article Views (full-text article views including HTML views, PDF and ePub downloads, according to the available data) and Abstracts Views on Vision4Press platform.
Data correspond to usage on the plateform after 2015. The current usage metrics is available 48-96 hours after online publication and is updated daily on week days.
Initial download of the metrics may take a while.