Fig. 6.
Download original image
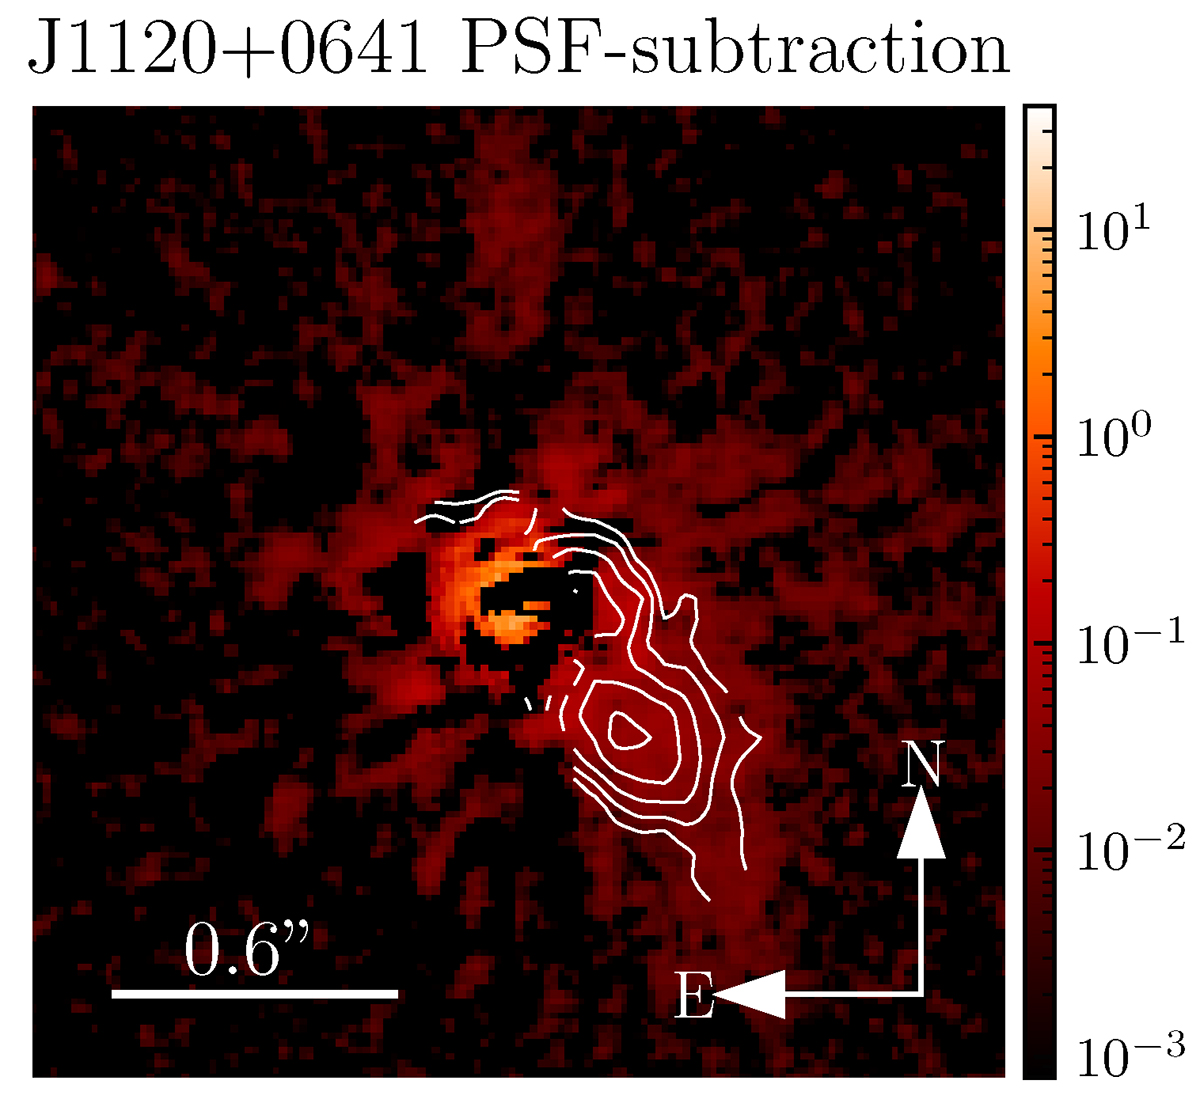
Overlay plot of the F200W PSF-subtracted image (background image with colour bar) and the [O III] λ5007 map (white contour). The emission in the PSF-subtracted F200W image largely overlaps with the [O III] λ5007 line map, indicating that the continuum and line emission originate from the same objects, i.e. the quasar host and the close companion. The marked scale of 0![]() 6 corresponds to a physical scale of 3.2 kpc at the redshift of the quasar.
6 corresponds to a physical scale of 3.2 kpc at the redshift of the quasar.
Current usage metrics show cumulative count of Article Views (full-text article views including HTML views, PDF and ePub downloads, according to the available data) and Abstracts Views on Vision4Press platform.
Data correspond to usage on the plateform after 2015. The current usage metrics is available 48-96 hours after online publication and is updated daily on week days.
Initial download of the metrics may take a while.