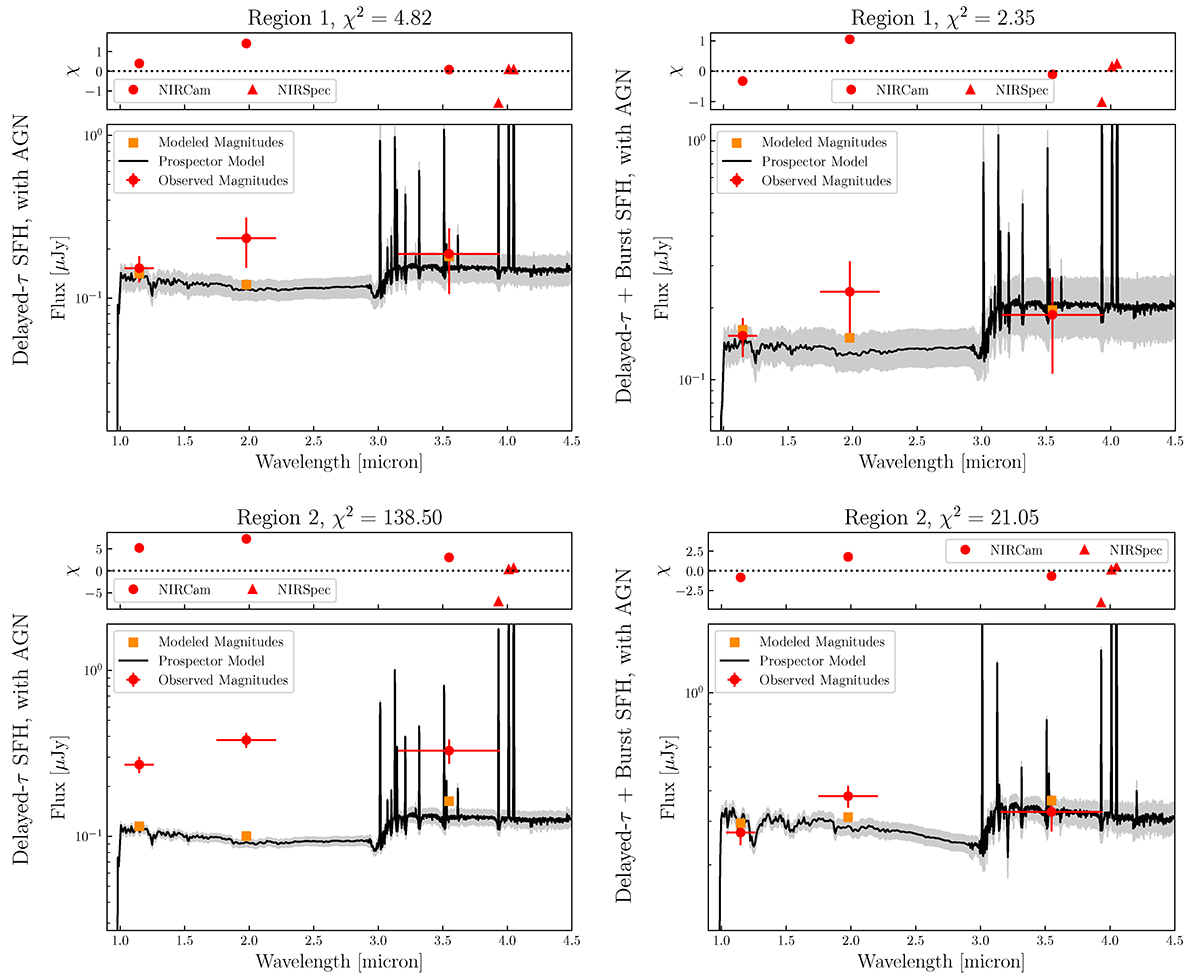
Fig. 8.
Download original image
Spectral energy distribution fitting for the host galaxy Region 1 (upper panels) and for the companion galaxy Region 2 (lower panels). The left and right columns correspond to a single delayed-τ SFH and a delayed-τ plus a starburst SFH, respectively. The red circles represent the NIRCam broad-band fluxes from image fitting, and the red triangles represent the observed Hβ and [O III] λλ4959,5007 line fluxes. The solid black line and the gray shaded region mark the Prospector modelled spectrum and its 1σ error, while the orange squares show the resulting model photometry.
Current usage metrics show cumulative count of Article Views (full-text article views including HTML views, PDF and ePub downloads, according to the available data) and Abstracts Views on Vision4Press platform.
Data correspond to usage on the plateform after 2015. The current usage metrics is available 48-96 hours after online publication and is updated daily on week days.
Initial download of the metrics may take a while.