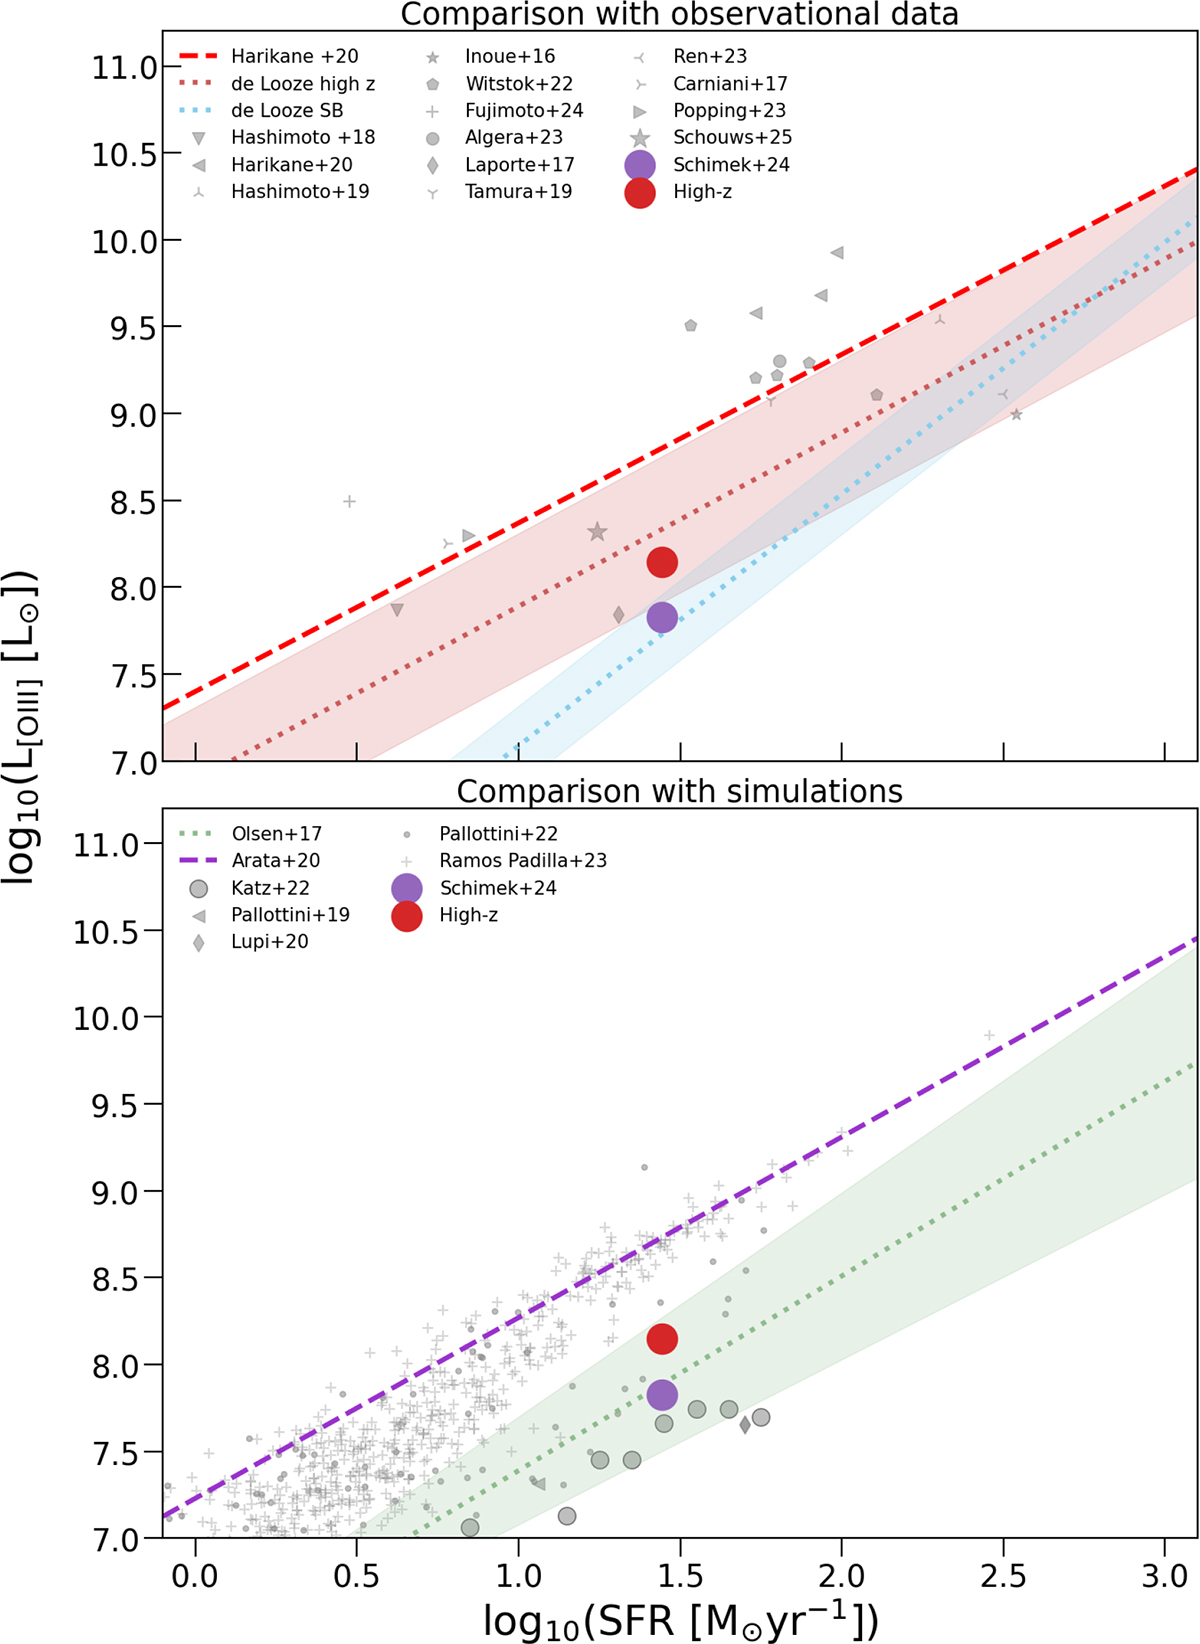
Fig. A.2.
Download original image
Total [OIII] luminosity as a function of SFR for the High-z model (red) and Schimek et al. (2024a,b) (purple). In the top panel we compare our models to observational data from Hashimoto et al. (2018) at z = 9, Harikane et al. (2020) at z ∼ 6, Hashimoto et al. (2019) at z ∼ 7, Inoue et al. (2016) at z ∼ 7, Witstok et al. (2022) at z = 6.7 − 7, Fujimoto et al. (2024) at z = 8.5, Algera et al. (2024) at z = 7.3, Laporte et al. (2017) at z = 8.3, Tamura et al. (2019) at z = 8.31, Ren et al. (2023) at z = 7.2, Carniani et al. (2017) at z ∼ 7, Popping (2023) (upper limit) at z = 13, and Schouws et al. (2025a,b) at z = 14.2. We used the relations from Harikane et al. (2020) for z = 6 − 9, as well as the SB and high-redshift relations from De Looze et al. (2014). In the bottom panel we compare our models to the simulated values from Katz et al. (2022) (z = 6), Pallottini et al. (2019) (z = 6), Lupi et al. (2020) (z = 6), Pallottini et al. (2022) (z = 7.7), and Ramos Padilla et al. (2023) (z = 6). The relations are from the simulations of Olsen et al. (2017) (z ≃ 6) and Arata et al. (2020) (z = 6 − 9).
Current usage metrics show cumulative count of Article Views (full-text article views including HTML views, PDF and ePub downloads, according to the available data) and Abstracts Views on Vision4Press platform.
Data correspond to usage on the plateform after 2015. The current usage metrics is available 48-96 hours after online publication and is updated daily on week days.
Initial download of the metrics may take a while.