Open Access
Fig. B.1.
Download original image
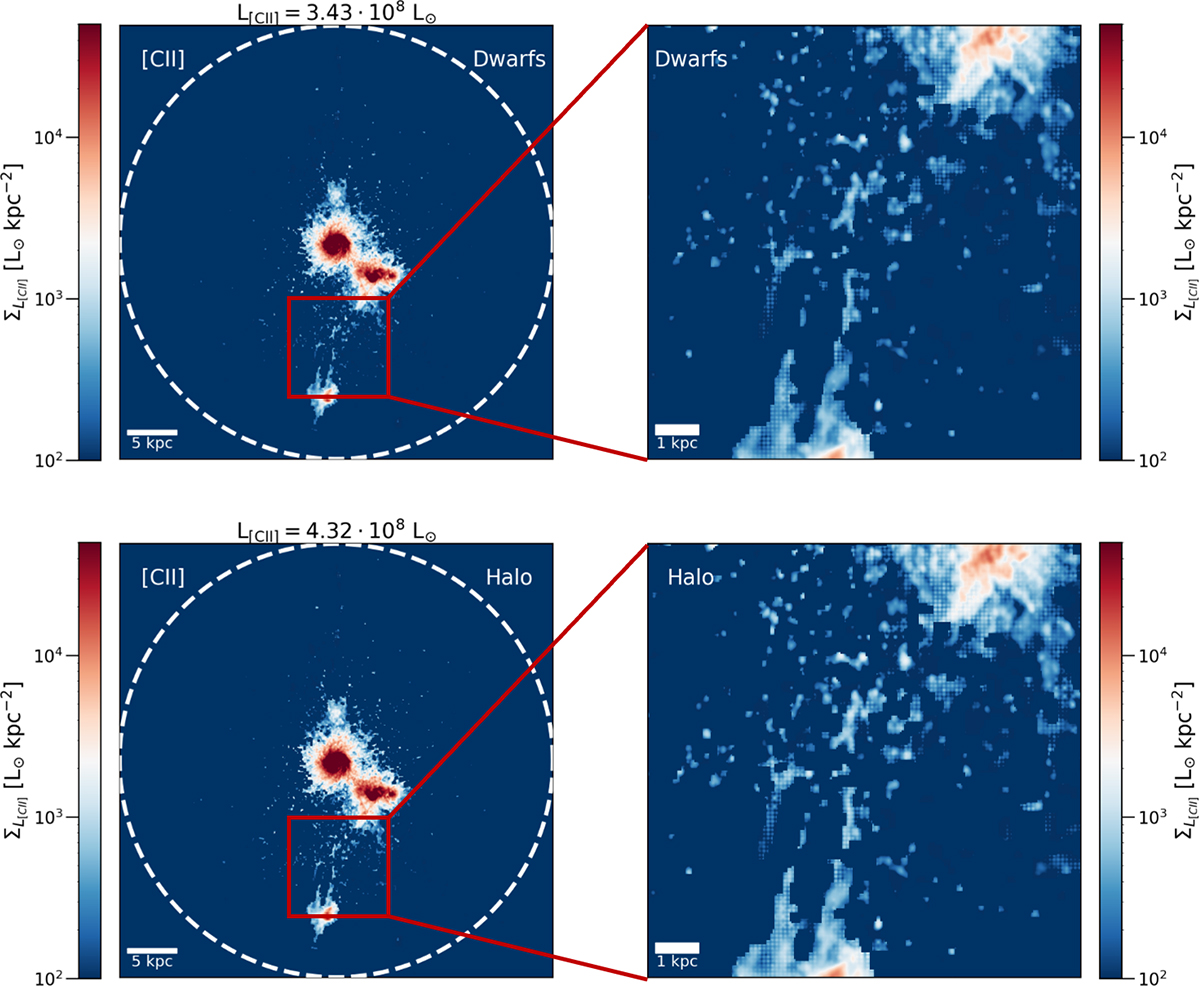
Emission maps of the [CII] line obtained with the Dwarfs model (top panels) and the Halo model (bottom panels). The right panels are zoomed-in images if the tidal tail between merger B and merger A. The dashed circles mark the extent of the virial radius of PONOS.
Current usage metrics show cumulative count of Article Views (full-text article views including HTML views, PDF and ePub downloads, according to the available data) and Abstracts Views on Vision4Press platform.
Data correspond to usage on the plateform after 2015. The current usage metrics is available 48-96 hours after online publication and is updated daily on week days.
Initial download of the metrics may take a while.