Open Access
Fig. 4.
Download original image
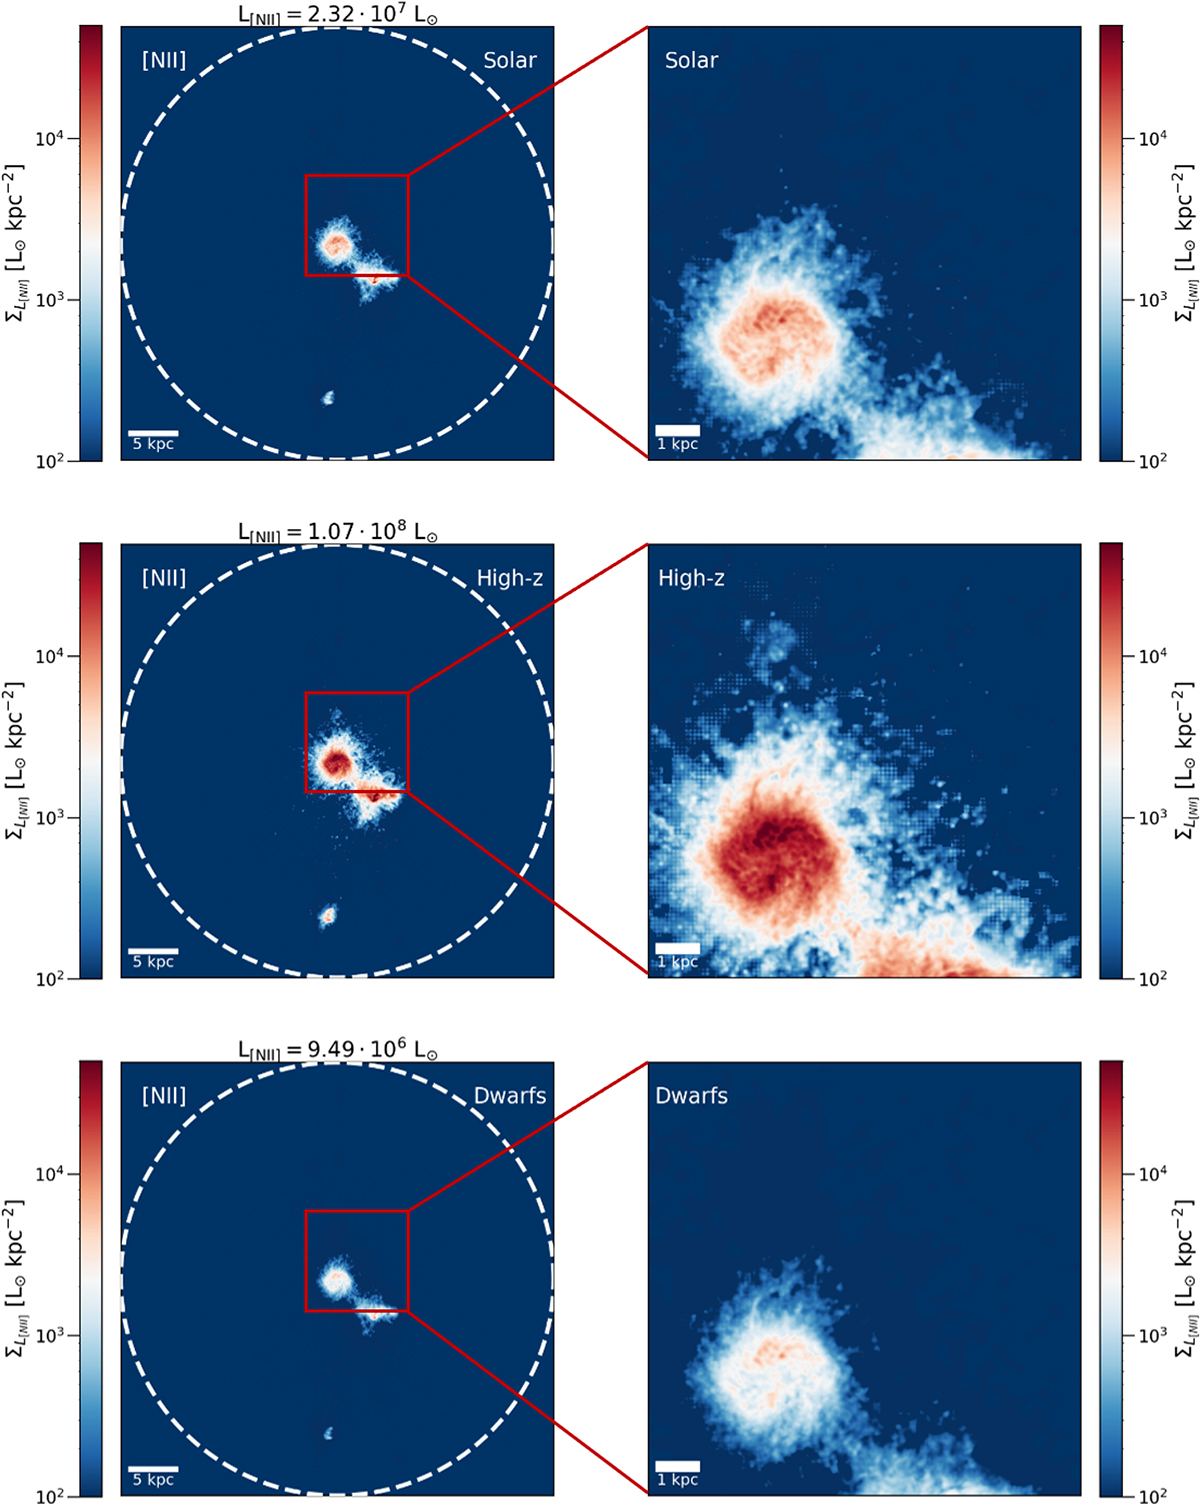
[N II] line emission maps obtained with the Solar model (top panels), the High-z model (middle panels), and the Dwarfs model (bottom panels). The right panels are zoomed-in images of the main disc and surrounding area. The white dashed circles mark the extent of Rvir of PONOS.
Current usage metrics show cumulative count of Article Views (full-text article views including HTML views, PDF and ePub downloads, according to the available data) and Abstracts Views on Vision4Press platform.
Data correspond to usage on the plateform after 2015. The current usage metrics is available 48-96 hours after online publication and is updated daily on week days.
Initial download of the metrics may take a while.