Fig. 7.
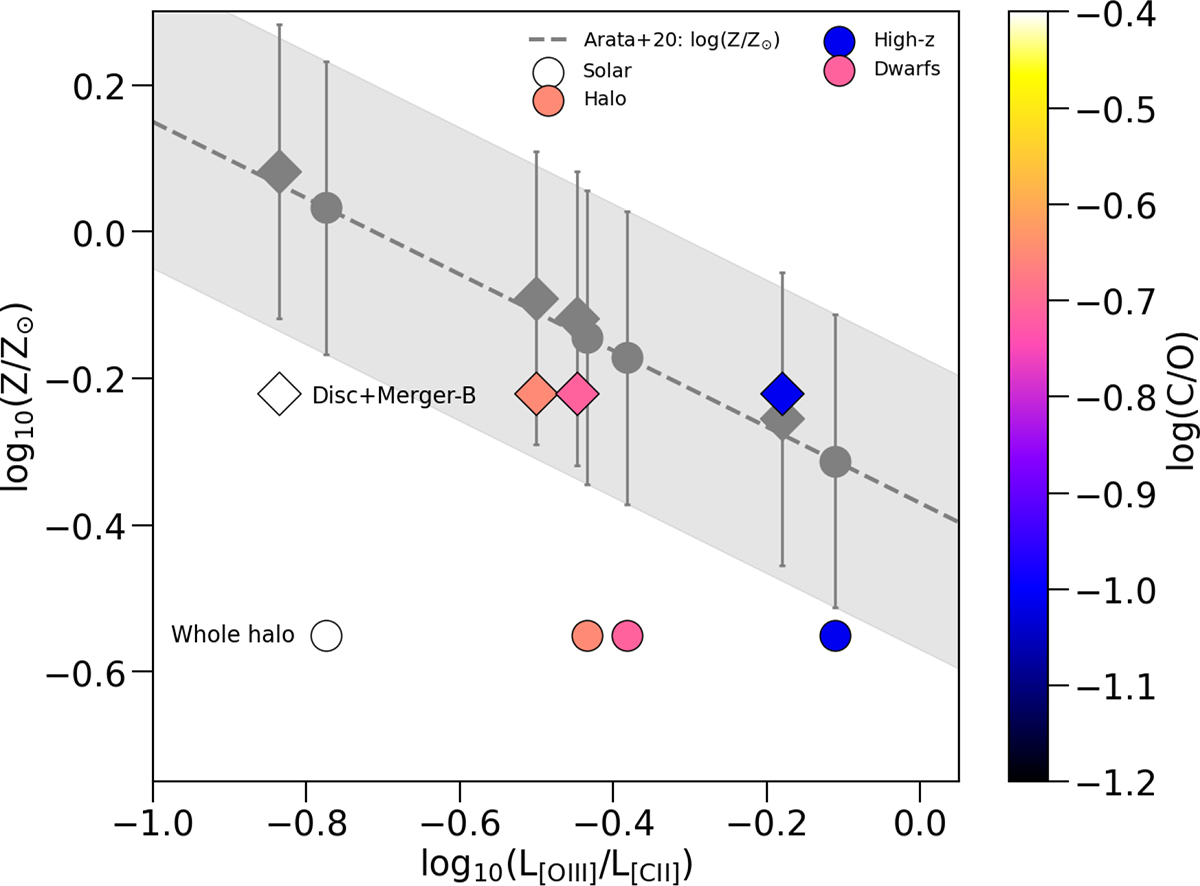
Download original image
[O III]/[C II] luminosity ratio vs. metallicity Z/Z⊙ in PONOS. Our models are colour-coded based on the assumed C/O abundance ratios. The circle symbols correspond to the luminosity ratios and average metallicities computed for the whole simulated halo (log(Z/Z⊙) = − 0.55). The diamonds show the contribution from the main disc and merger B component only (log(Z/Z⊙) = − 0.22). The grey dashed line is the best-fit relation from Arata et al. (2020) for their simulated sample of z = 6 − 9 galaxies, with the grey area corresponding to their ≲0.2 dex dispersion. The grey symbols are the PONOS models shifted to the metallicity values expected from the Arata et al. (2020) relation.
Current usage metrics show cumulative count of Article Views (full-text article views including HTML views, PDF and ePub downloads, according to the available data) and Abstracts Views on Vision4Press platform.
Data correspond to usage on the plateform after 2015. The current usage metrics is available 48-96 hours after online publication and is updated daily on week days.
Initial download of the metrics may take a while.