Fig. 8.
Download original image
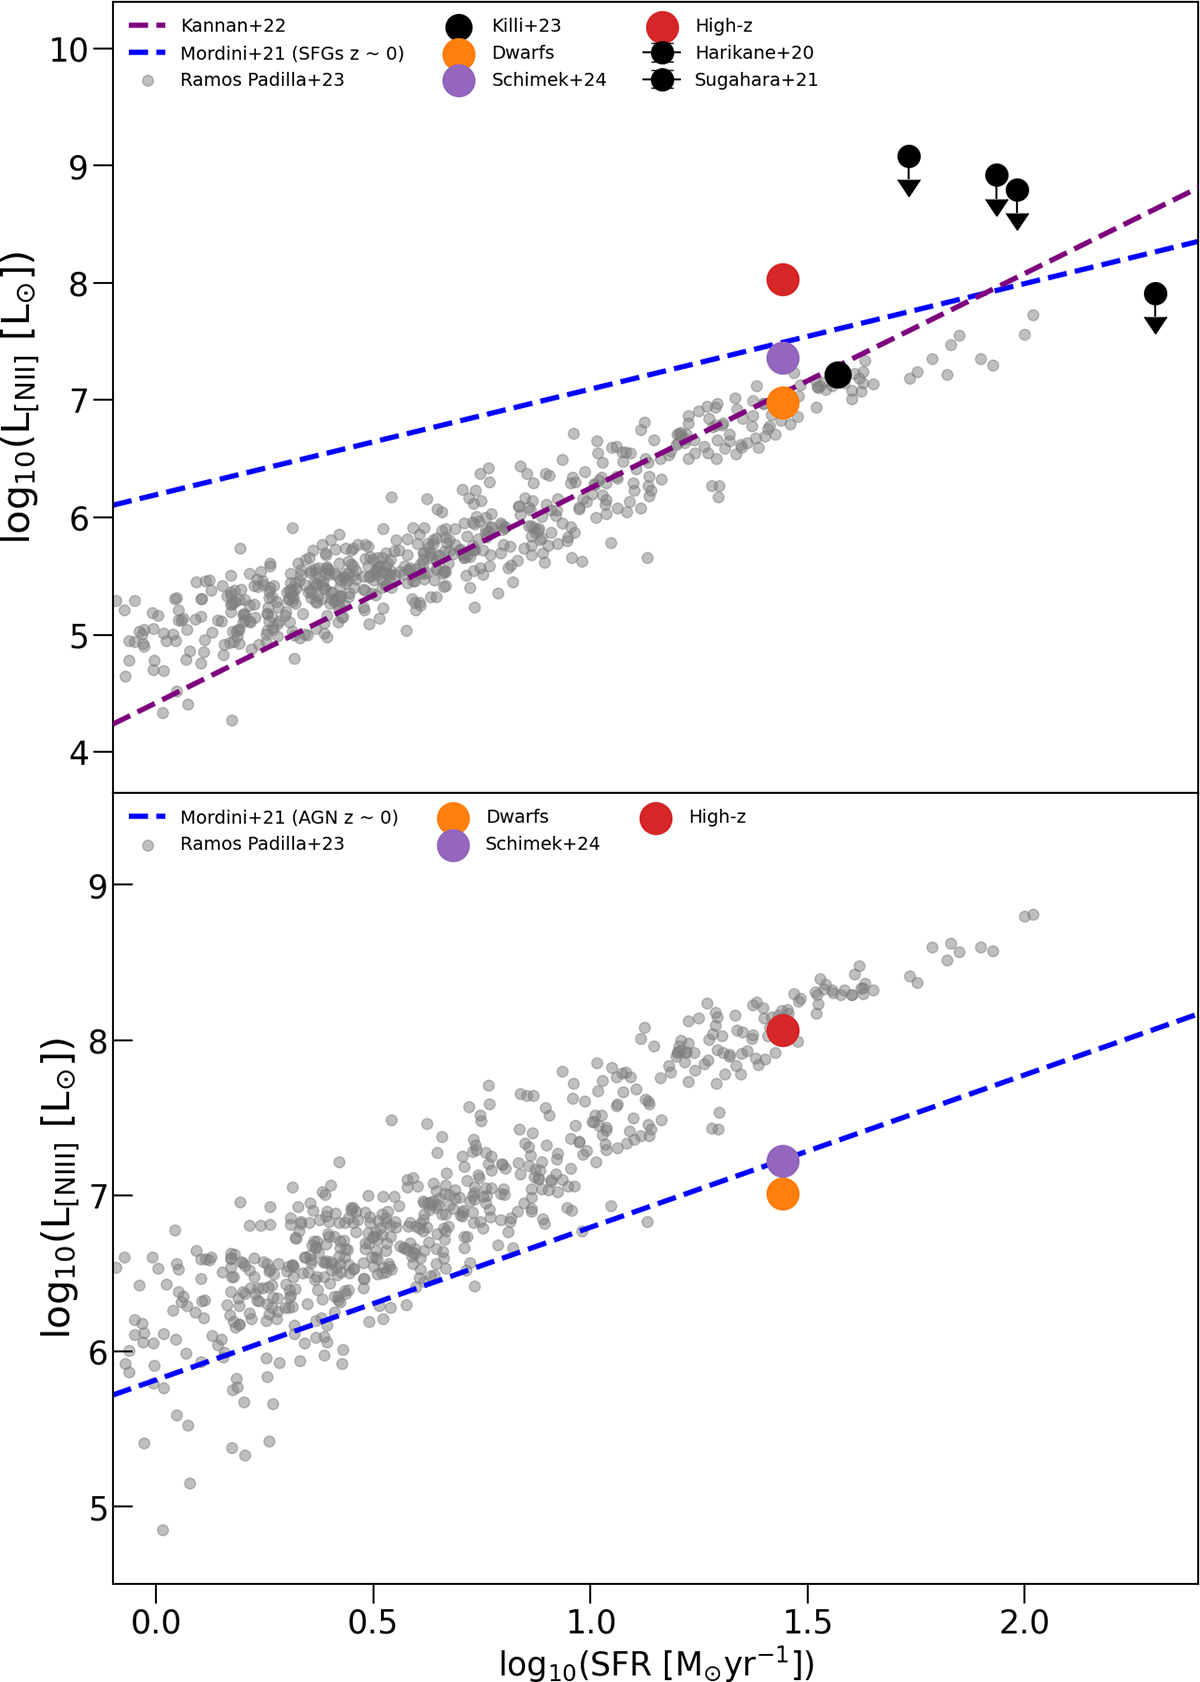
Total [N II] luminosity (top panel) and [N III] luminosity (bottom panel) as functions of SFR for the High-z model (red), Dwarfs model (orange), and Schimek et al. (2024a,b) (purple). Both panels include comparisons with the simulated z = 6 sample from Ramos Padilla et al. (2023) (grey circles) and the linear relations from Mordini et al. (2021) based on observations of galaxies in the local Universe. In the top panel we include the [N II] observation from Killi et al. (2023) (black circle) at z ∼ 7, the observed upper limits from Harikane et al. (2020) at z ∼ 6 and Sugahara et al. (2021) at z ∼ 7 (black circles with arrows), and the theoretical relation from Kannan et al. (2022) (z = 6 − 10).
Current usage metrics show cumulative count of Article Views (full-text article views including HTML views, PDF and ePub downloads, according to the available data) and Abstracts Views on Vision4Press platform.
Data correspond to usage on the plateform after 2015. The current usage metrics is available 48-96 hours after online publication and is updated daily on week days.
Initial download of the metrics may take a while.