Fig. 9.
Download original image
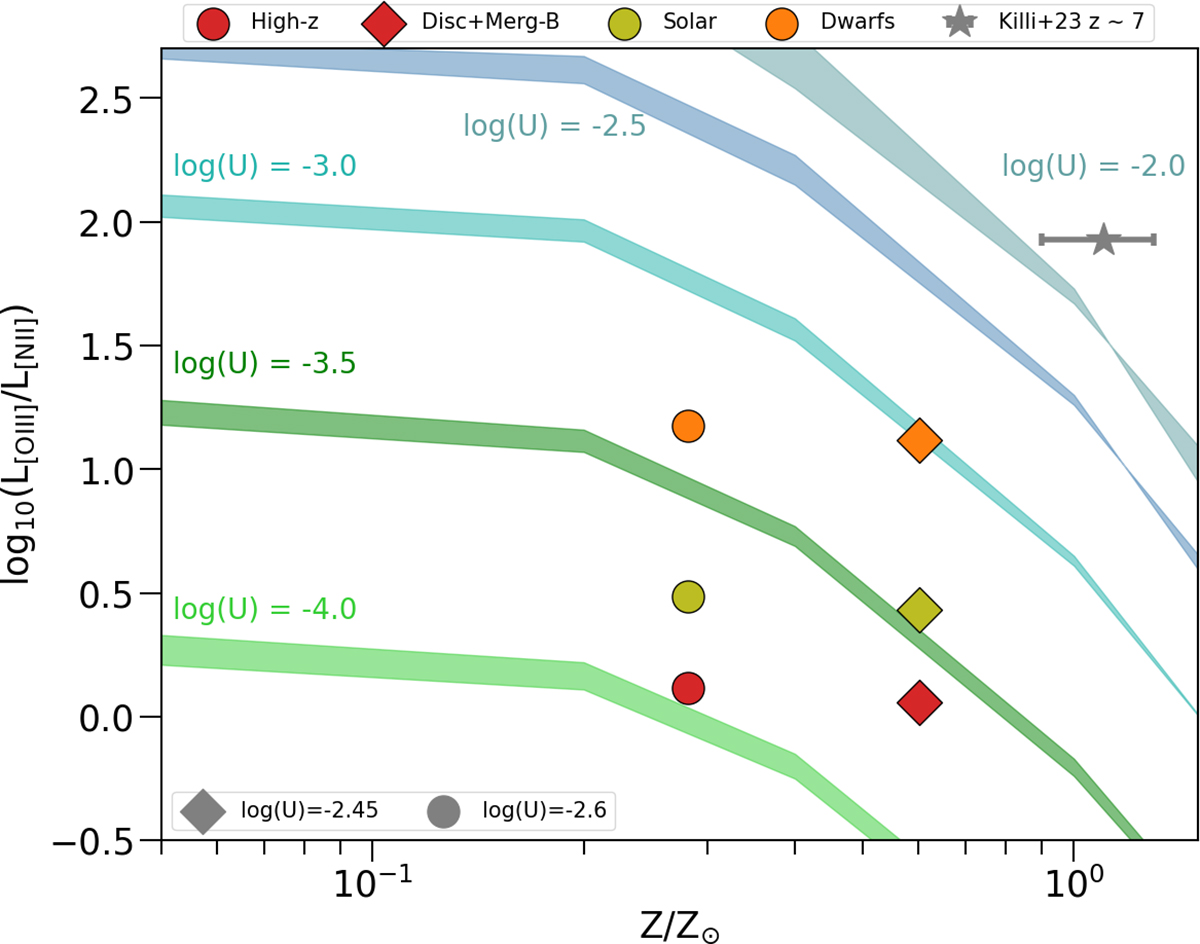
[O III]/[N II] as a function of metallicity Z [Z⊙] for the Solar model (yellow-green), High-z model (red) and Dwarfs model (orange). The circles show the contribution from the whole galactic halo, while the diamonds consider only the main disc and merger B. The shaded regions are the model predictions of the [O III]/[N II] ratio as functions of metallicity from Pereira-Santaella et al. (2017), with each shaded region corresponding to a model assuming a certain ionisation parameter: log(U) = − 4, −3.5, −3, −2.5 and −2. The width of the shaded regions spans the density range: log(nH) = 1 − 4. The grey star represents the observed ratio from Killi et al. (2023) at z ∼ 7.
Current usage metrics show cumulative count of Article Views (full-text article views including HTML views, PDF and ePub downloads, according to the available data) and Abstracts Views on Vision4Press platform.
Data correspond to usage on the plateform after 2015. The current usage metrics is available 48-96 hours after online publication and is updated daily on week days.
Initial download of the metrics may take a while.