Open Access
Fig. 4
Download original image
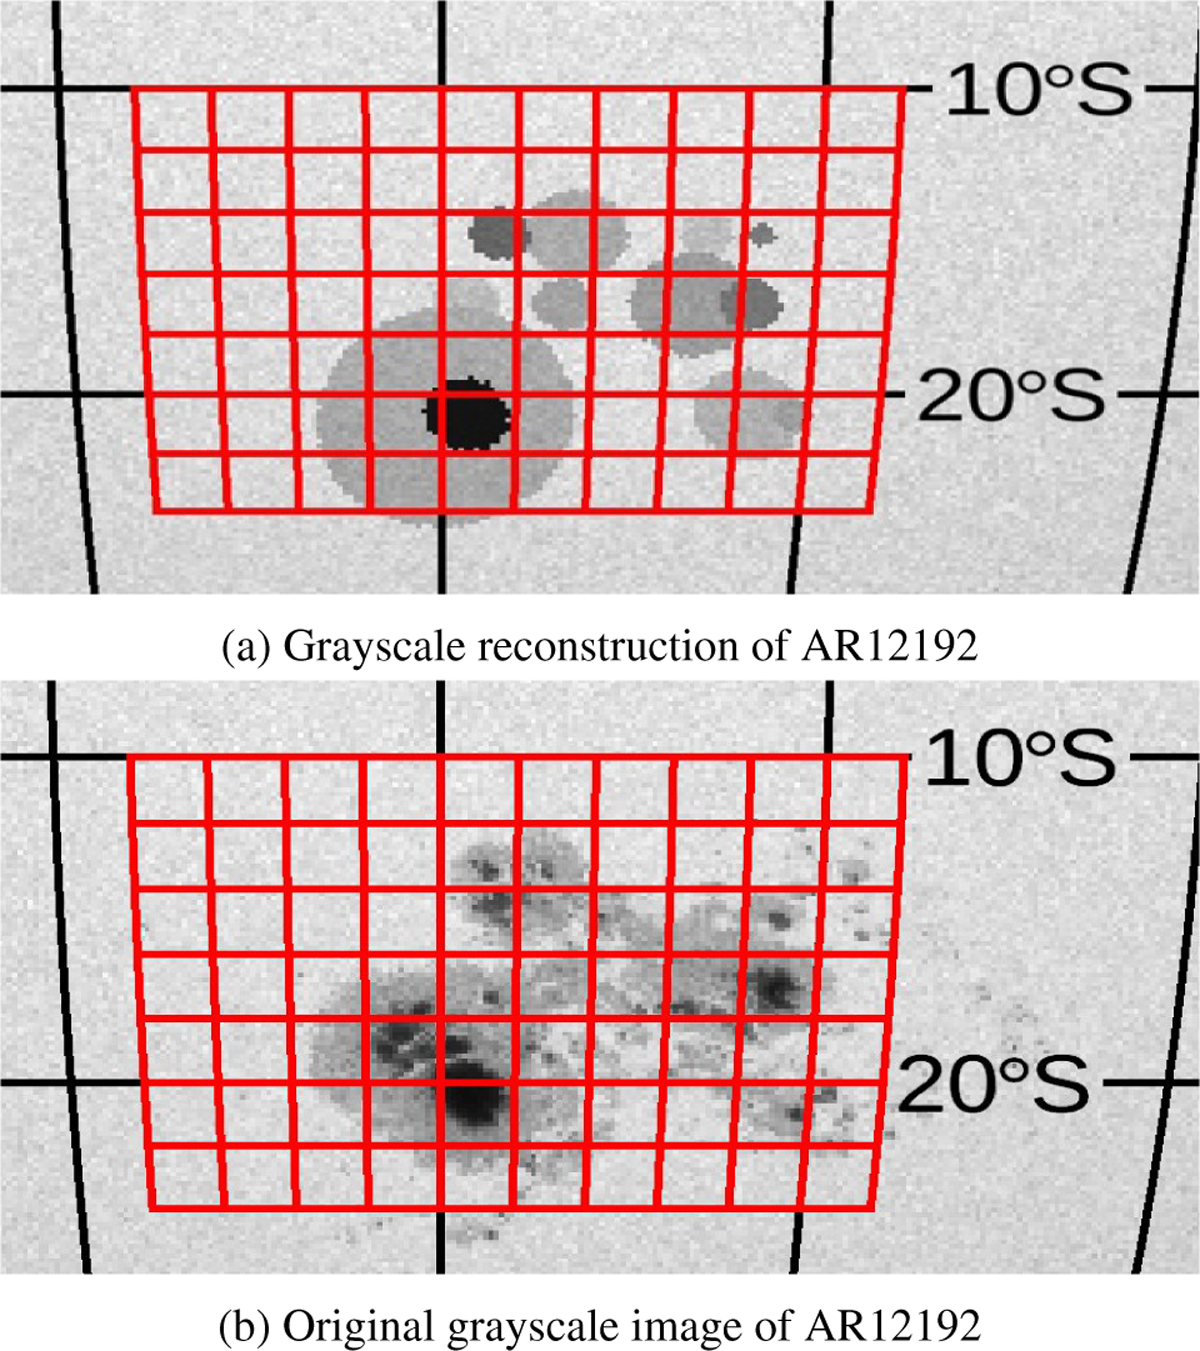
Grayscale images of AR12192 as (a) reconstructed from the Bayesian parameter estimation for the simulated transits at latitudes −15°, −17°, and −21° and (b) extracted from the SDO HMI intensitygram. The gridded region covers latitudes −10° to −24° and longitudes −8° to −12° in 2° increments.
Current usage metrics show cumulative count of Article Views (full-text article views including HTML views, PDF and ePub downloads, according to the available data) and Abstracts Views on Vision4Press platform.
Data correspond to usage on the plateform after 2015. The current usage metrics is available 48-96 hours after online publication and is updated daily on week days.
Initial download of the metrics may take a while.