Fig. 5
Download original image
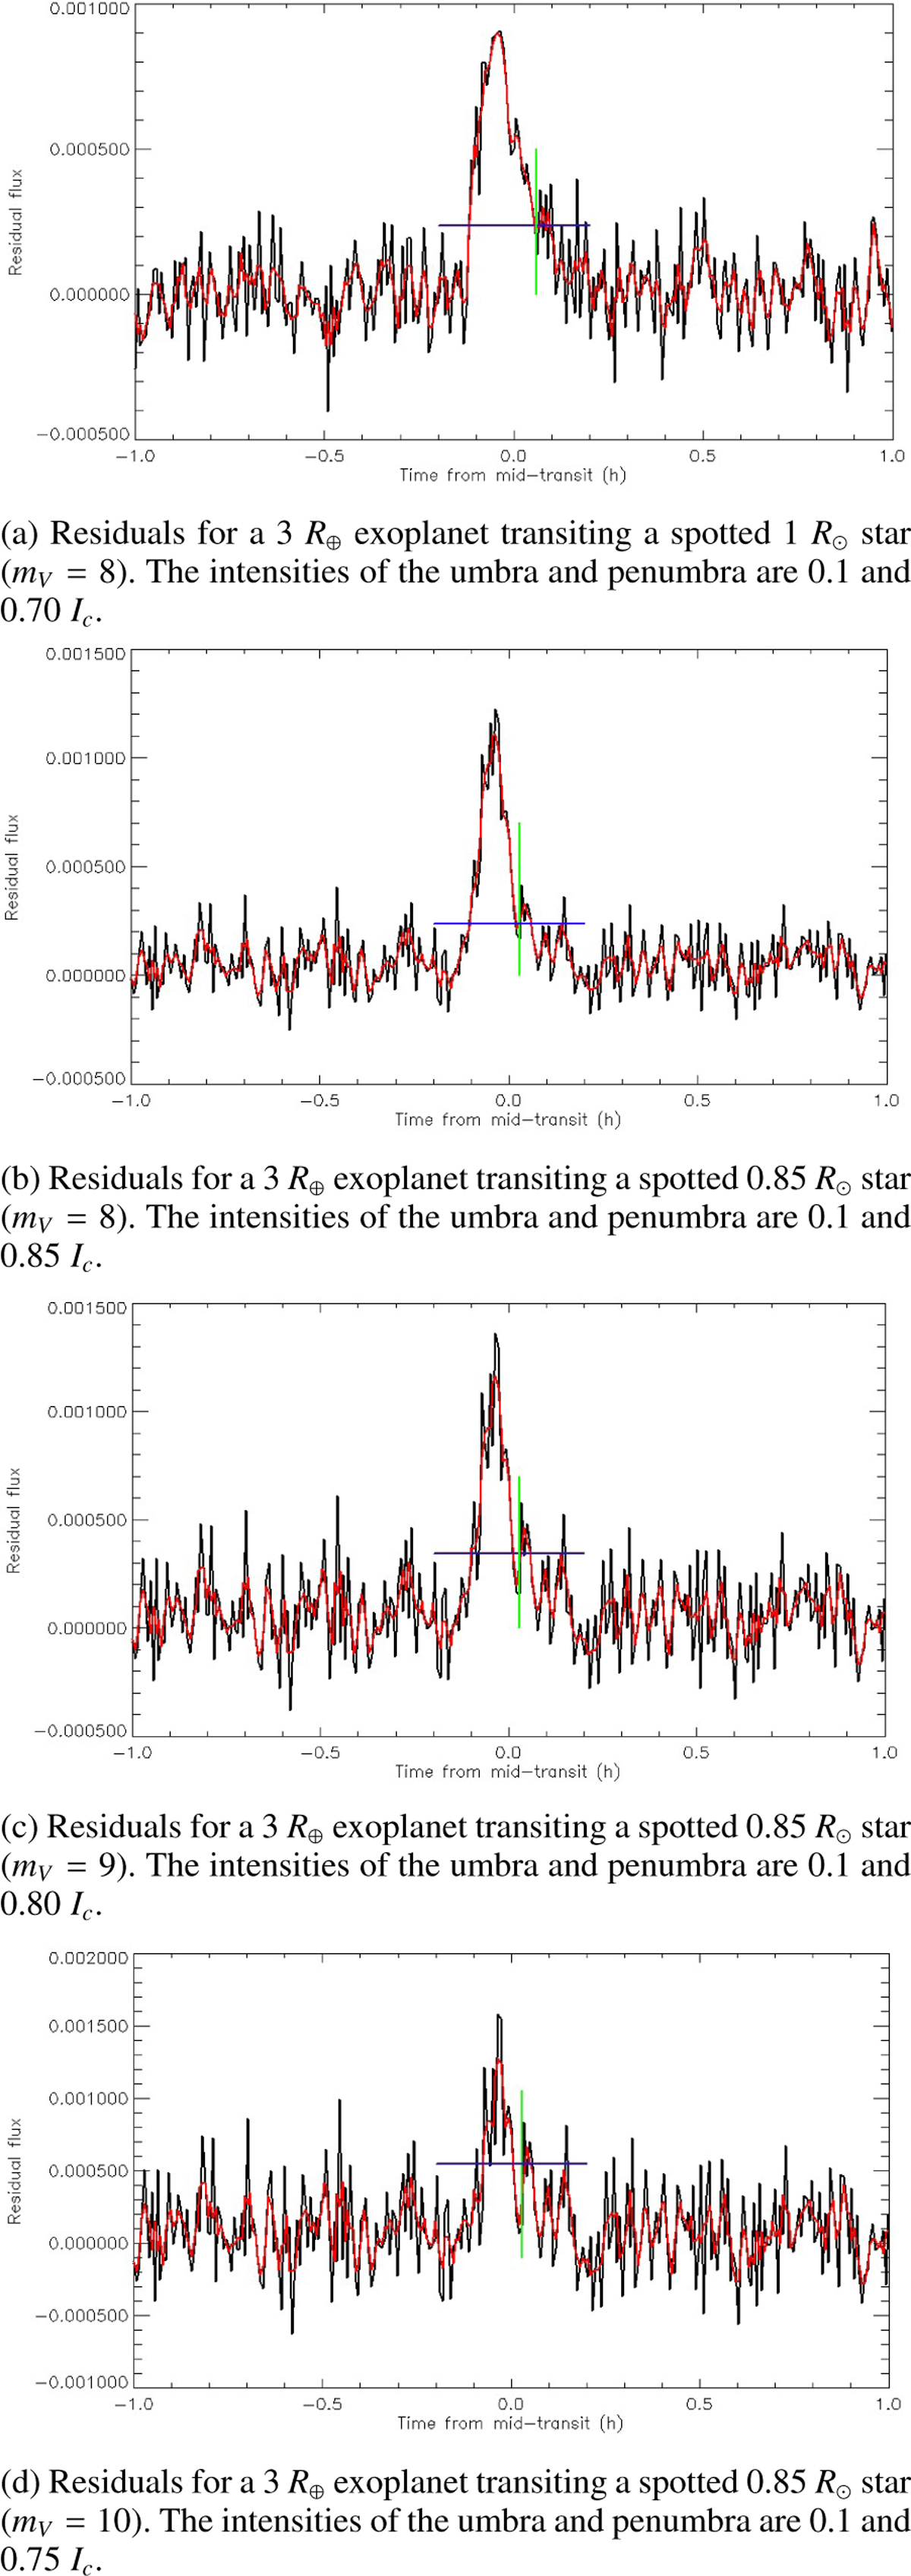
Residuals (black) from the subtraction of noiseless, spotted transit light curves from noise-added, spotted light curves for four combinations of stellar radius, planetary radius, and stellar apparent magnitude. Red curves represent the residuals after three-point smoothing. Horizontal blue lines are the 3 × σ75s noise level, while vertical green lines mark the umbra-penumbra boundaries. Detectable penumbral have residuals above 3 × σ75 s.
Current usage metrics show cumulative count of Article Views (full-text article views including HTML views, PDF and ePub downloads, according to the available data) and Abstracts Views on Vision4Press platform.
Data correspond to usage on the plateform after 2015. The current usage metrics is available 48-96 hours after online publication and is updated daily on week days.
Initial download of the metrics may take a while.