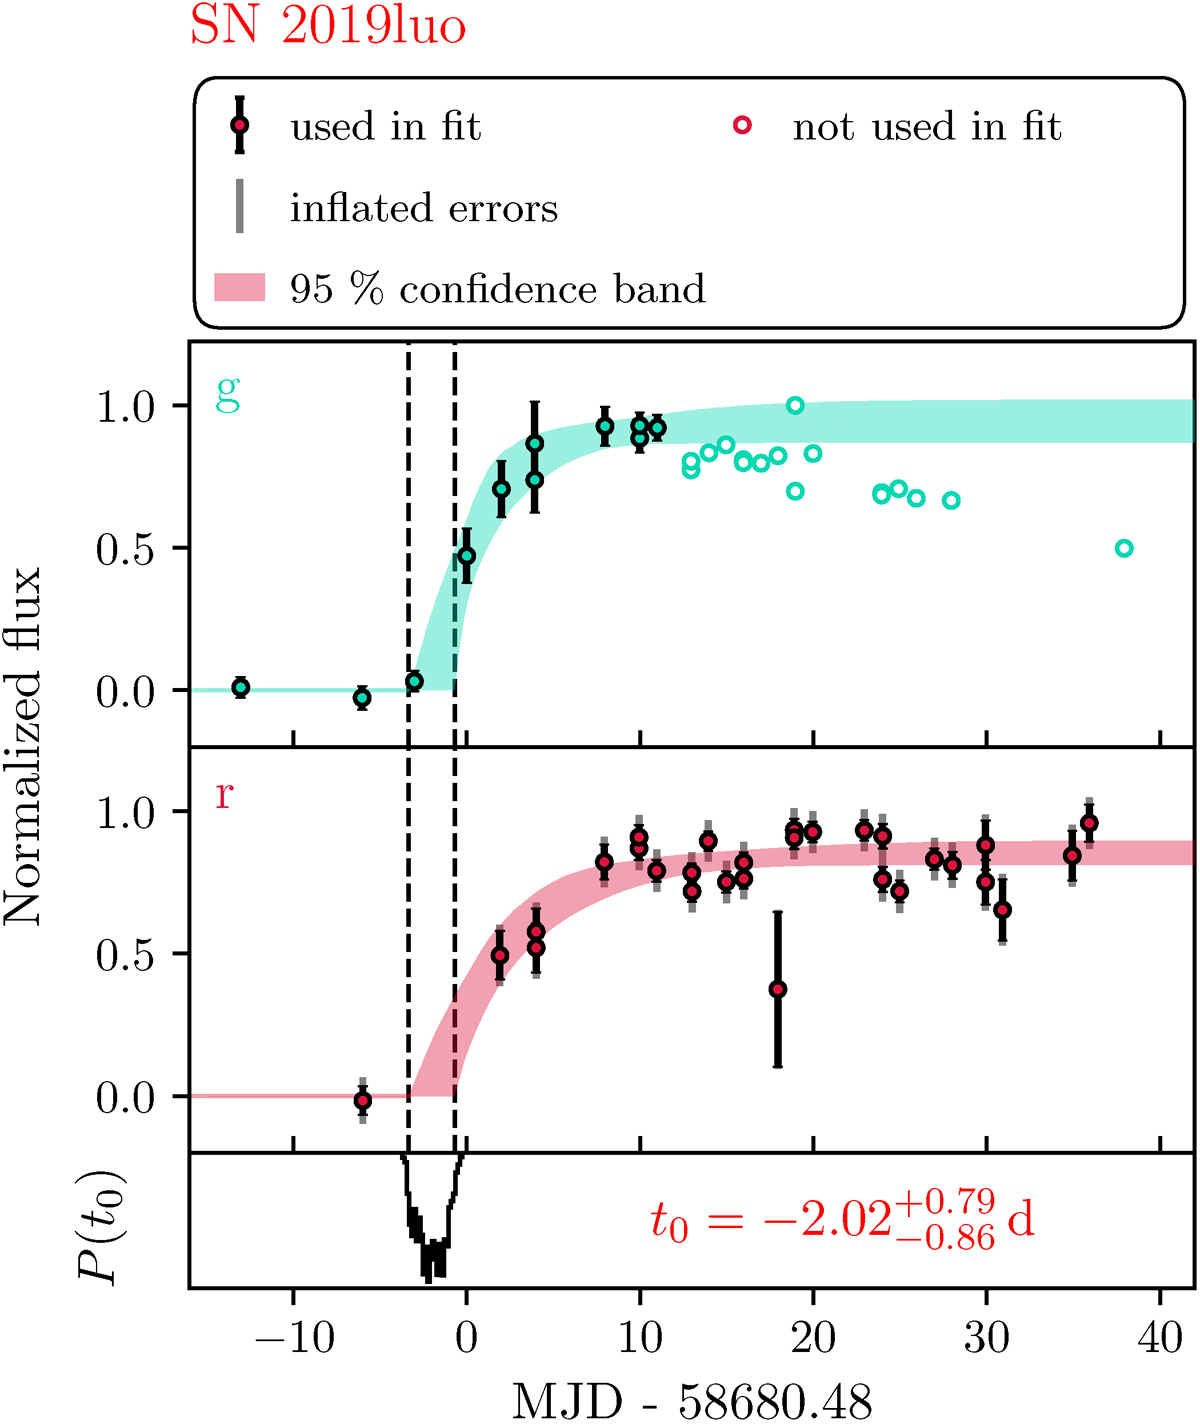
Fig. 2.
Download original image
Example of the time-of-explosion determination. We fitted an inverse exponential model (Eq. (8)) to the observed flux curves (black error bars), modelling the available bands (here g and r) jointly with a shared explosion time t0. The coloured bands (cyan for g, red for r) show the 95% confidence regions of the fits. The bottom panel displays the t0 posterior along with the inferred value relative to the first detection and its uncertainty. Finally, the inflated flux errors, including the additional fitted uncertainty σadd, are shown in grey. Here, the reported g-band uncertainties accurately capture the scatter around the model, resulting in minimal error inflation. In contrast, the r-band errors show noticeable inflation, with σadd around 0.06 mag.
Current usage metrics show cumulative count of Article Views (full-text article views including HTML views, PDF and ePub downloads, according to the available data) and Abstracts Views on Vision4Press platform.
Data correspond to usage on the plateform after 2015. The current usage metrics is available 48-96 hours after online publication and is updated daily on week days.
Initial download of the metrics may take a while.