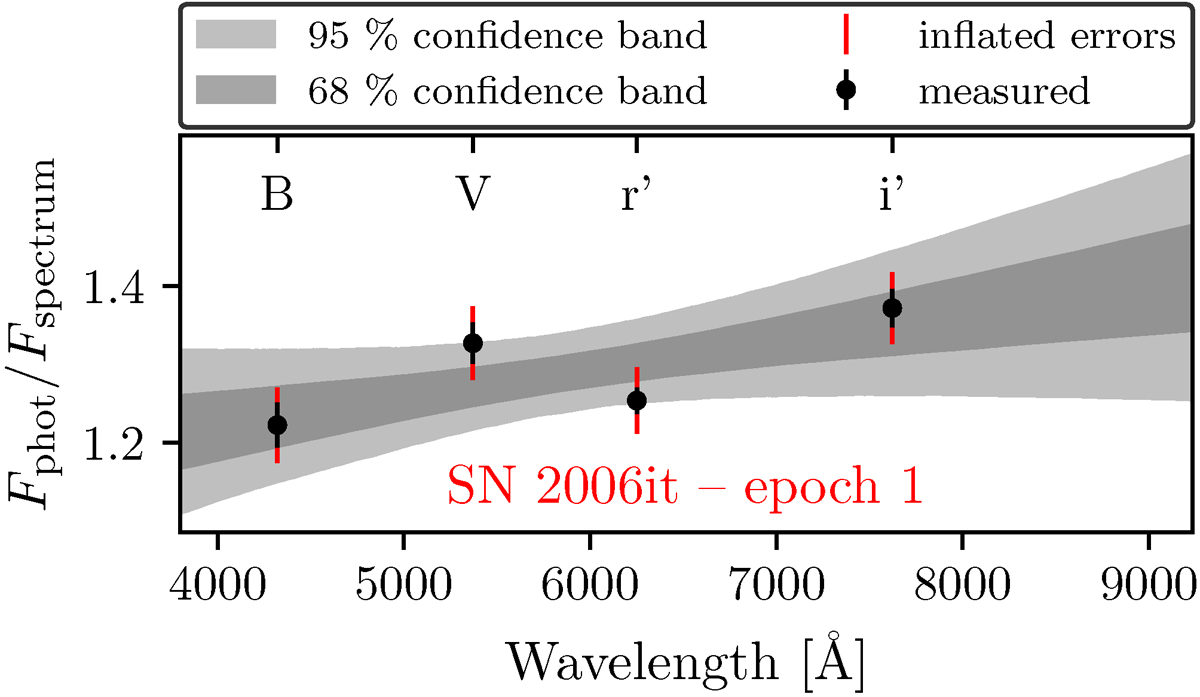
Fig. 4.
Download original image
Example of the linear flux calibration procedure. The plot shows the measured ratios of the photometric and spectroscopic flux Fphot/Fspectrum for the first epoch of SN 2006it as a function of wavelength in black. We performed a Bayesian fit of the ratios (see Sect. 4.3) to identify all possible linear flux calibration corrections. Of the possible curves 68% fall within the dark grey contour and 95% within the light grey contour. Although the underlying curves are straight, the contours naturally exhibit curvature. An important part of the fit is inflating the measured errors if necessary, accounting for additional unquantified uncertainties, such as the mixing of different photometric systems or underestimated uncertainties in the interpolated magnitudes. In the plot, the inflated errors are highlighted in red. In this specific example, the errors are substantially inflated because the data points deviate significantly from a linear trend within the measurement uncertainties.
Current usage metrics show cumulative count of Article Views (full-text article views including HTML views, PDF and ePub downloads, according to the available data) and Abstracts Views on Vision4Press platform.
Data correspond to usage on the plateform after 2015. The current usage metrics is available 48-96 hours after online publication and is updated daily on week days.
Initial download of the metrics may take a while.