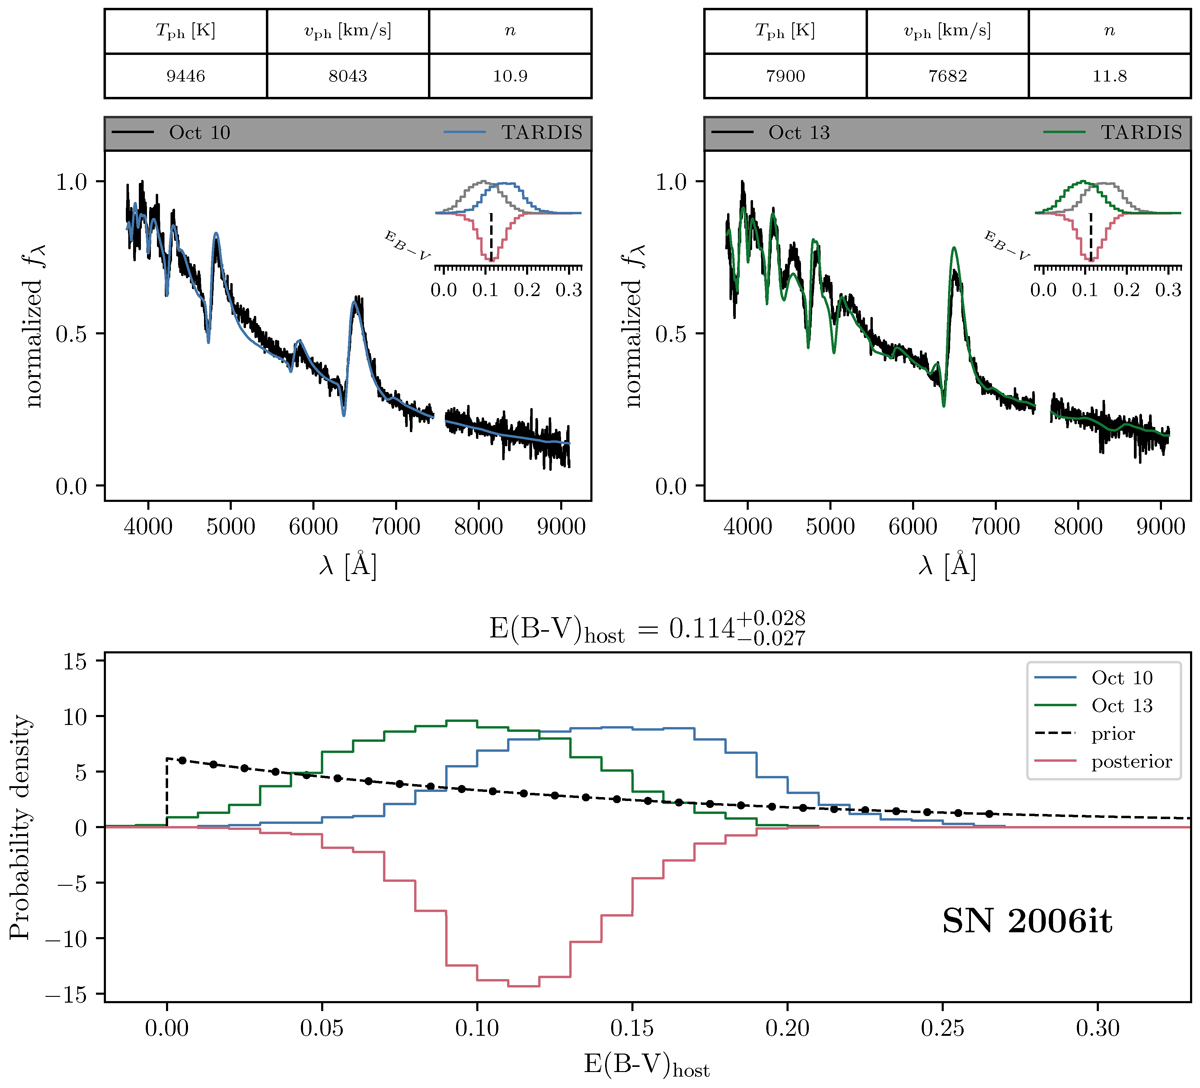
Fig. 6.

Download original image
Example spectral fits. We show the spectral fits for SN 2006it at two epochs (Oct. 10 and Oct. 13), analogous to the hypothetical SN used in Fig. 5. The bottom panel displays the E(B − V) constraints from spectral fits of possible flux calibration solutions, with epoch 1 in blue and epoch 2 in green. The constraints from both epochs align well within the uncertainties. The dashed black line represents the exponential approximation of the Hatano et al. (1998) extinction prior, with dots indicating evaluation points for multiplication with the individual epoch constraints. We plot the final E(B − V) posterior (red) in the negative probability density direction for visual separation. The upper part of the figure visualises the spectral fits contributing to the E(B − V) and subsequently θ/vph determinations. While fits of many different flux-calibrated spectra and E(B − V) values contribute, we show only one representative fit per epoch for simplicity. To select this fit, we follow a two-step process. First, we choose one of the flux calibration solutions whose best-fit E(B − V) is closest to the median of the posterior. Next, within this flux calibration solution, we analogously identify the fit from the E(B − V) grid that is nearest to the median of the posterior. The normalised observed specific flux fλ of this choice appears in black, with the corresponding maximum-likelihood fits in blue (epoch 1) and green (epoch 2). The key physical parameters for the selected fits are listed on the top. Small insets in each panel mirror the bottom half of the figure, visualising the E(B − V) constraints with the other epoch greyed out. The dashed line in the inset marks the median E(B − V) value, which is used in the plotted fits.
Current usage metrics show cumulative count of Article Views (full-text article views including HTML views, PDF and ePub downloads, according to the available data) and Abstracts Views on Vision4Press platform.
Data correspond to usage on the plateform after 2015. The current usage metrics is available 48-96 hours after online publication and is updated daily on week days.
Initial download of the metrics may take a while.


