Fig. 8.
Download original image
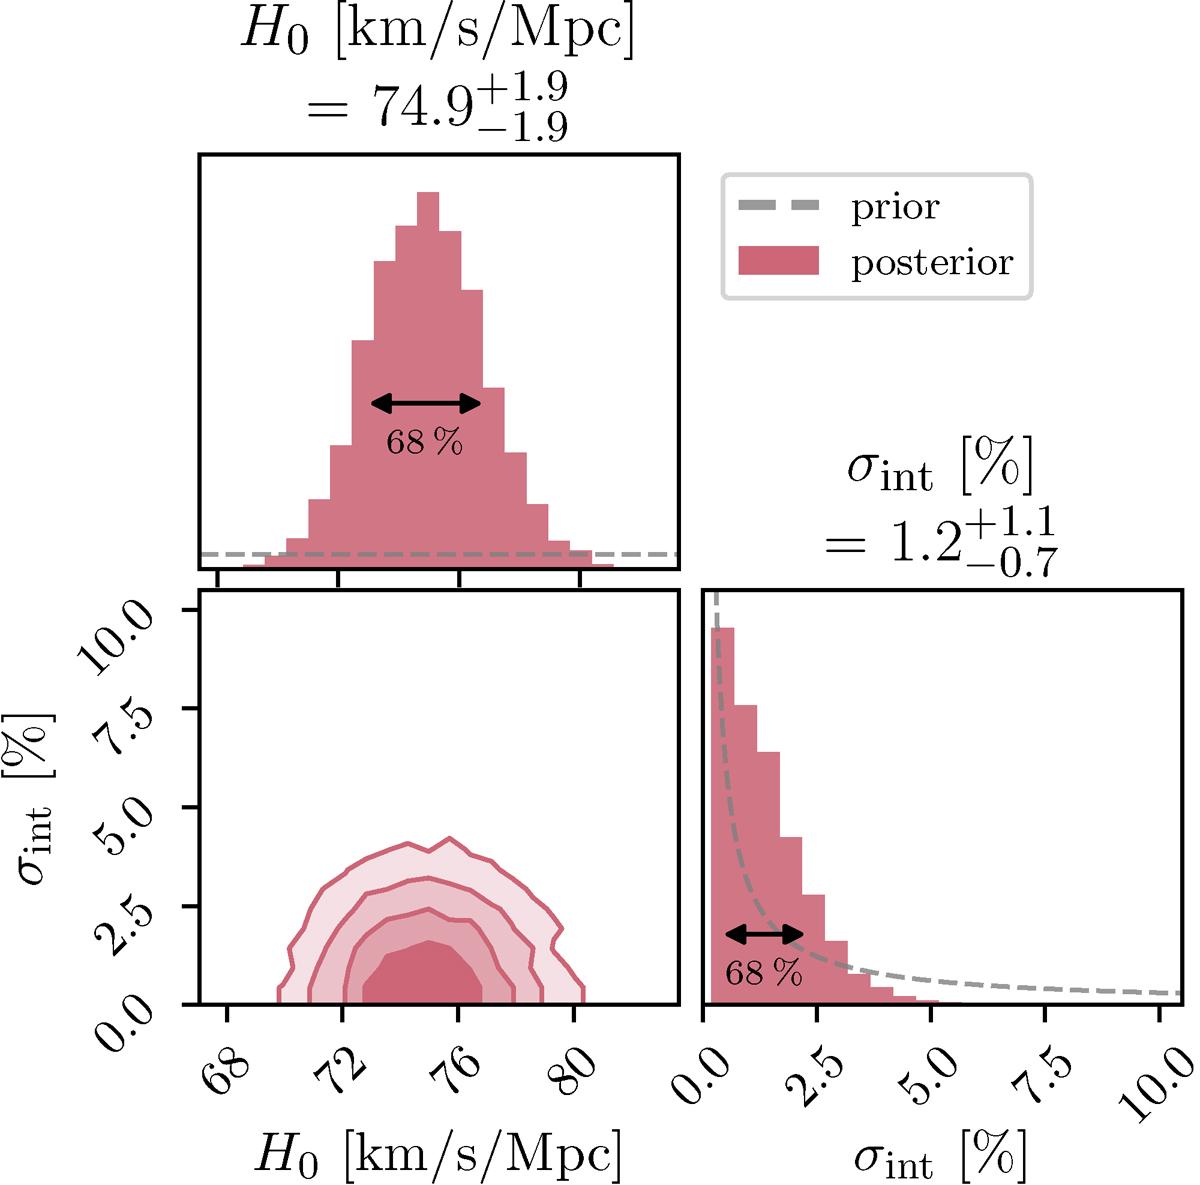
Posterior of the Bayesian ensemble EPM fit (marginalised over the times of explosion and peculiar velocities of the SNe). The plot shows the 68% confidence intervals for the one-dimensional distributions. The two dimensional projection displays the 39.3%,67.5%,86.5%,95.6% confidence regions (corresponding to the 1σ, 1.5σ, 2σ, 2.5σ levels of a two-dimensional Gaussian distribution, as described in the corner Python package documentation) (https://corner.readthedocs.io/en/latest/pages/sigmas/). The prior distributions for the one-dimensional marginalised distributions are shown as grey dashed lines.
Current usage metrics show cumulative count of Article Views (full-text article views including HTML views, PDF and ePub downloads, according to the available data) and Abstracts Views on Vision4Press platform.
Data correspond to usage on the plateform after 2015. The current usage metrics is available 48-96 hours after online publication and is updated daily on week days.
Initial download of the metrics may take a while.