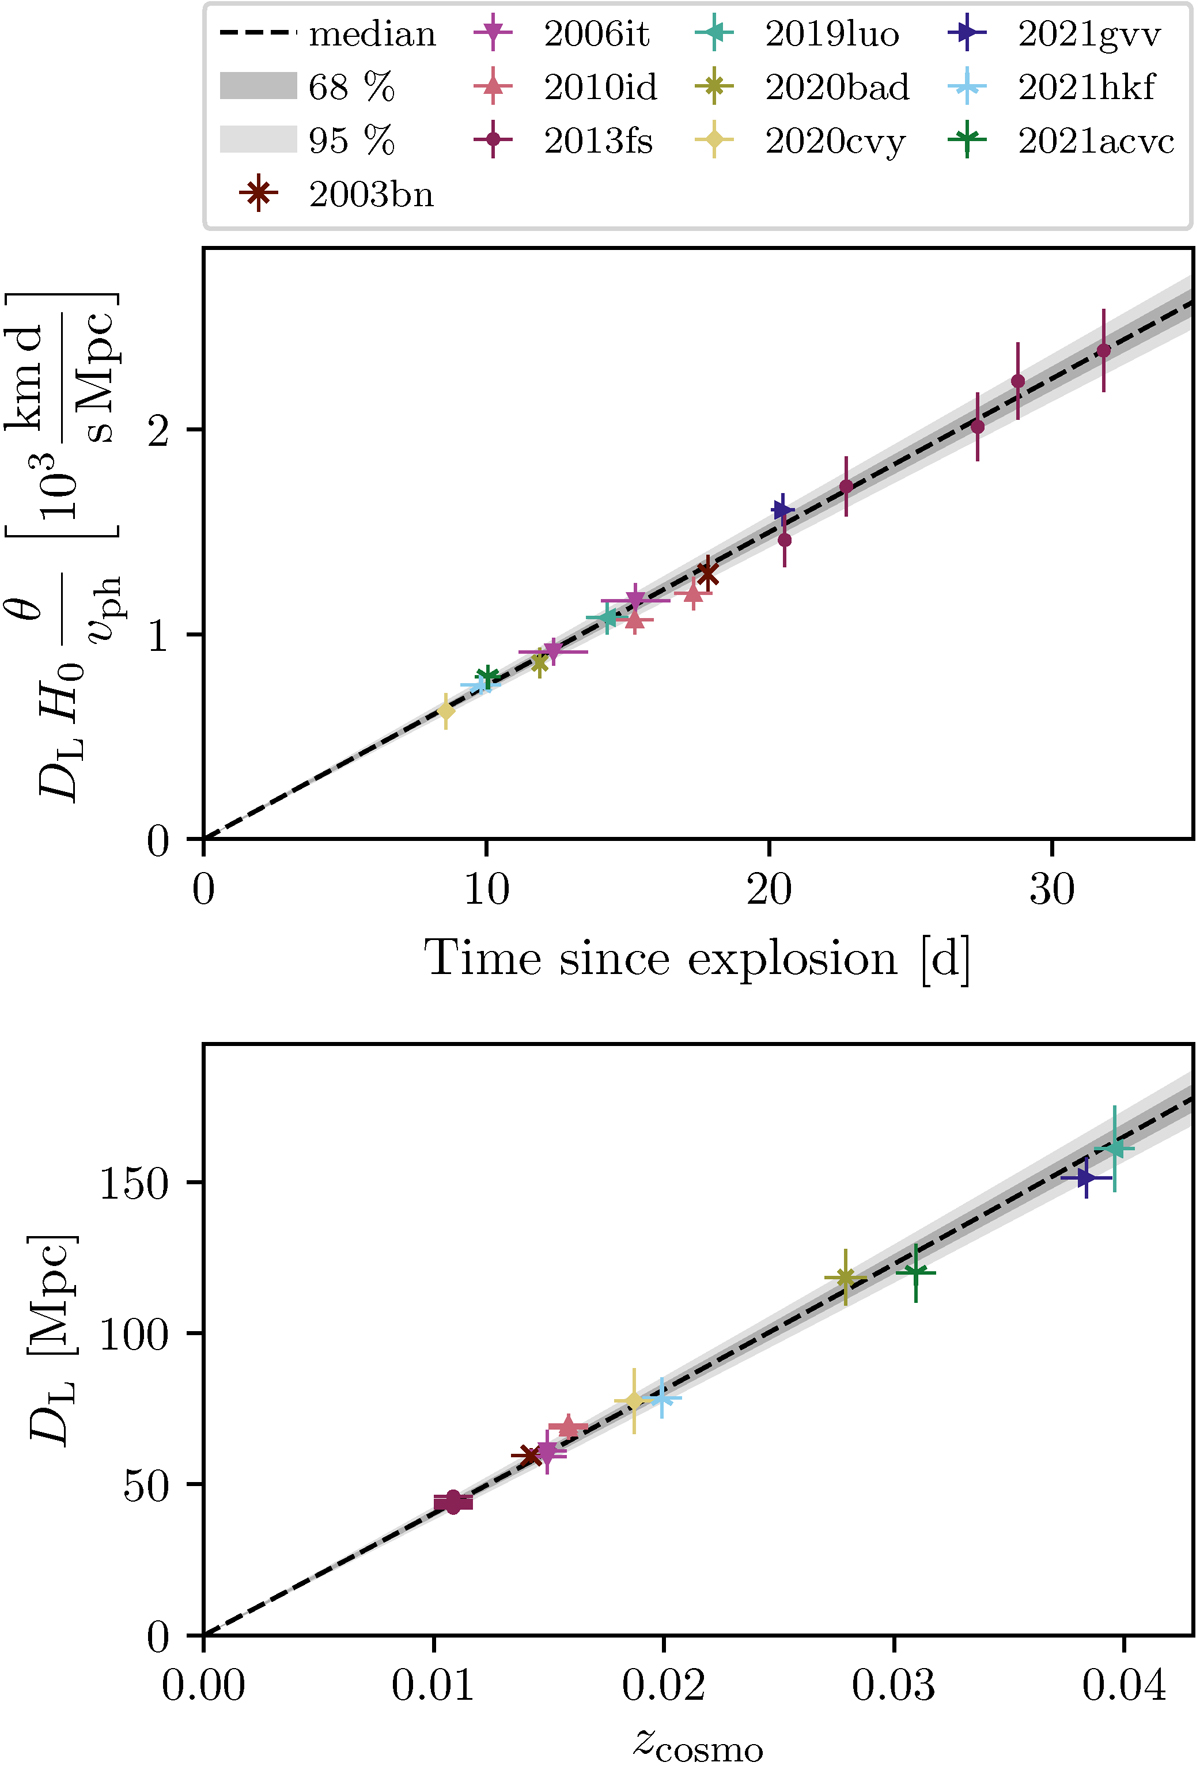
Fig. 9.
Download original image
Visualisation of the Bayesian ensemble EPM fit. The upper panel presents the combined EPM regressions for all SNe, with θ/vph values scaled by the Hubble-free luminosity distance DL(zcosmo)H0, placing them on a uniform absolute scale. Each spectrum contributes one measurement to this plot, with the median of the fit indicated by a dashed line. The 68% and 95% confidence intervals are shown in light and dark grey, respectively. Each SN is colour-coded for clarity. The error bars include the inferred additional uncertainty σint. In the bottom panel, we complement this visualisation with a plot similar to a classical Hubble diagram, where DL values, derived by solving Eq. (5), are plotted against their redshifts. Unlike traditional Hubble diagrams, each point represents one epoch of an SN, with all spectra for a given SN appearing at the same redshift. Special care is needed when interpreting the error bars. In the EPM-like visualisation, the y-errors include both θ/vph and peculiar velocity uncertainties, whereas in the Hubble-diagram-like visualisation, they include both θ/vph and time of explosion uncertainties. The time of explosion and peculiar velocity uncertainties are completely correlated for all epochs of an SN, introducing correlations in the y-error bars that cannot be captured in this figure. The situation is even worse for the uncertainties in the x-direction, which are solely the time of explosion and peculiar velocity uncertainties, and thus are 100% correlated. The data points are thus not independent, making it more difficult to assess aspects like the dispersion around the fit. It is important to remember, however, that we do not use the plotted data points for the fit; instead, we use the θ/vph values directly.
Current usage metrics show cumulative count of Article Views (full-text article views including HTML views, PDF and ePub downloads, according to the available data) and Abstracts Views on Vision4Press platform.
Data correspond to usage on the plateform after 2015. The current usage metrics is available 48-96 hours after online publication and is updated daily on week days.
Initial download of the metrics may take a while.