Fig. 1
Download original image
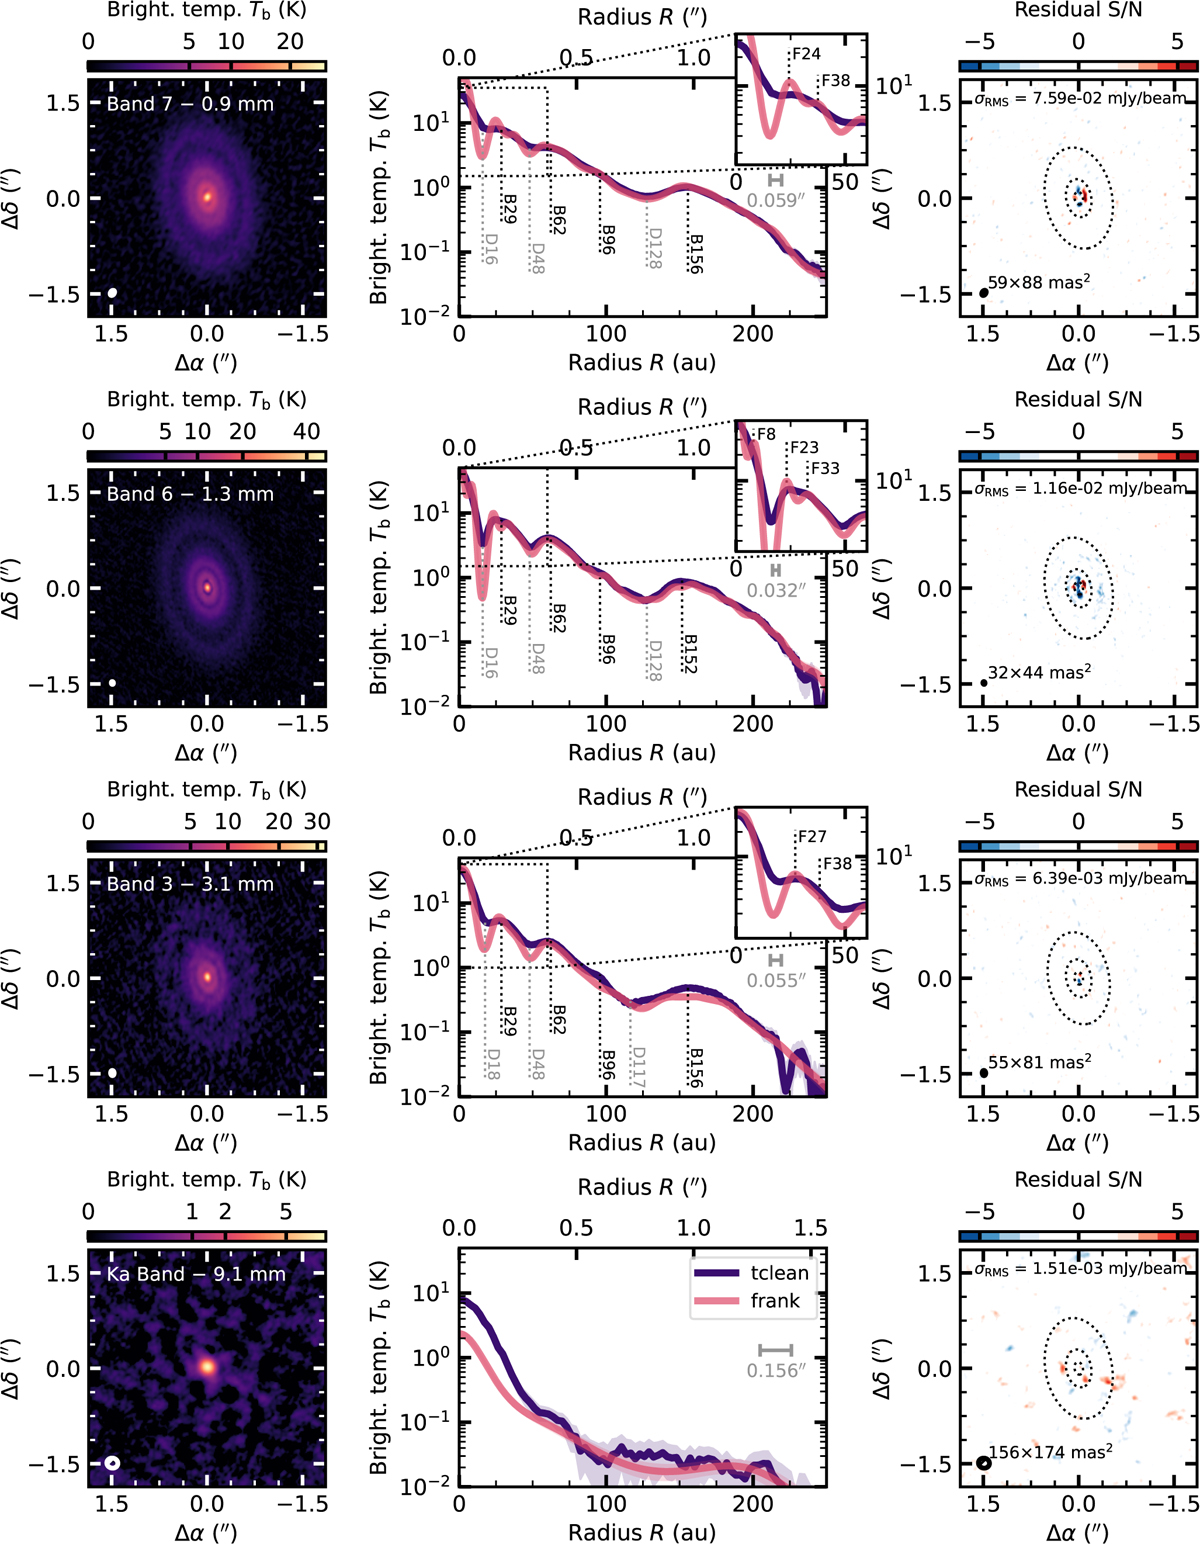
From top to bottom: CI Tau’s ALMA Band 7, 6, 3, and VLA Ka band continuum emission. Left column: CLEAN images. Central column: Azimuthally averaged surface brightness radial profiles. Those obtained from the tclean images are in violet, purple is used for the best-fit frank profiles (a point-source component was subtracted from the 3.1 and 9.1 mm visibilities before fitting). Right column: residual images of the frank fit. Dotted ellipses mark the location of the dark rings in the CLEAN images. The synthesised CLEAN beam is shown as an ellipse in the bottom-left corner of each image and as a segment with full width half maximum equal to the beam minor axis in each radial profile subplot.
Current usage metrics show cumulative count of Article Views (full-text article views including HTML views, PDF and ePub downloads, according to the available data) and Abstracts Views on Vision4Press platform.
Data correspond to usage on the plateform after 2015. The current usage metrics is available 48-96 hours after online publication and is updated daily on week days.
Initial download of the metrics may take a while.