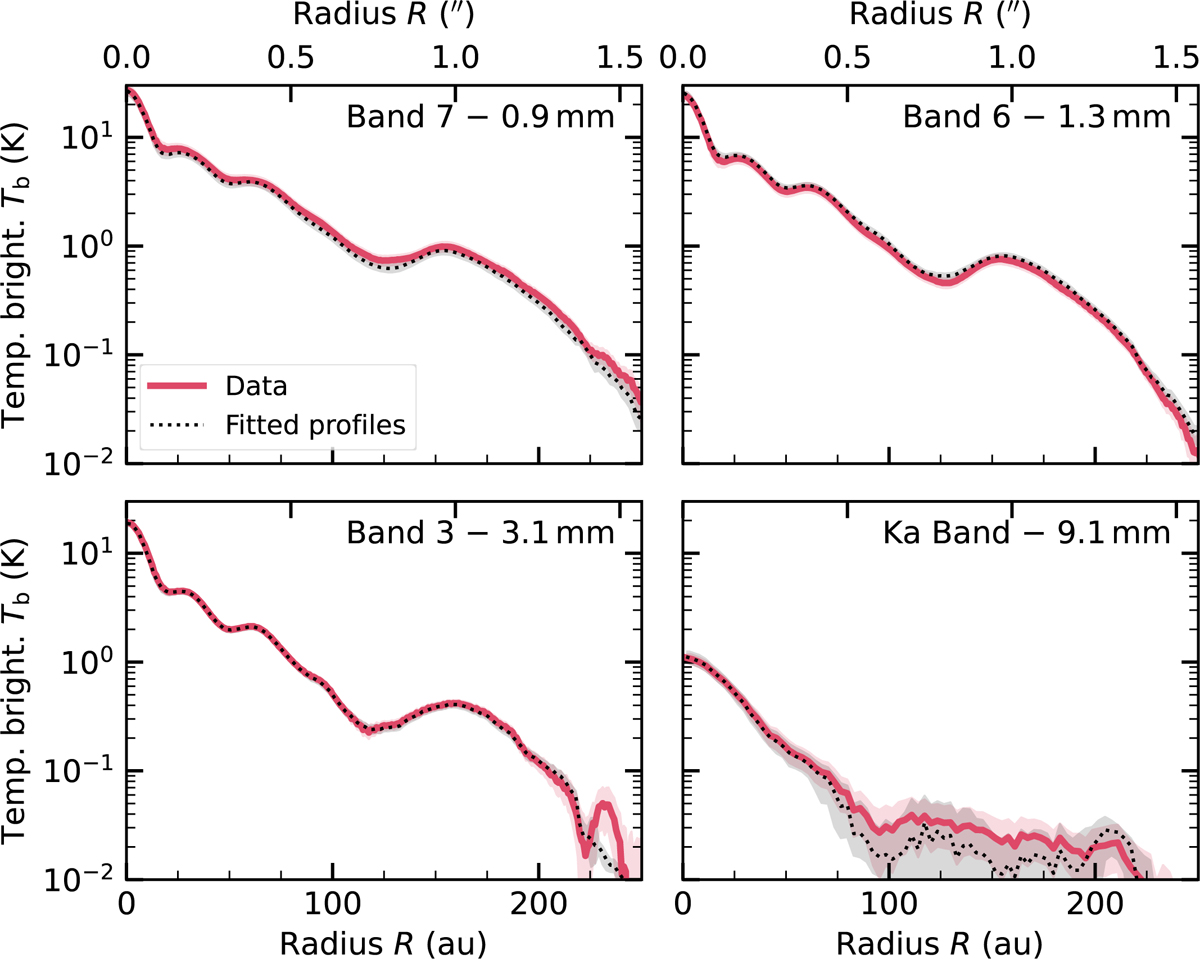
Fig. F.1
Download original image
Comparison between the azimuthally averaged ALMA Band 7, 6, 3, and VLA Ka band surface brightness radial profiles (purple solid line and shaded region, including the calibration uncertainty) with the posterior distribution of our fit (black dashed line and shaded region, for the median and the area between the 16th and 84th percentiles). Results from the high (low) resolution fit are displayed for ALMA (VLA) data. An excellent agreement between models and observations can be seen.
Current usage metrics show cumulative count of Article Views (full-text article views including HTML views, PDF and ePub downloads, according to the available data) and Abstracts Views on Vision4Press platform.
Data correspond to usage on the plateform after 2015. The current usage metrics is available 48-96 hours after online publication and is updated daily on week days.
Initial download of the metrics may take a while.