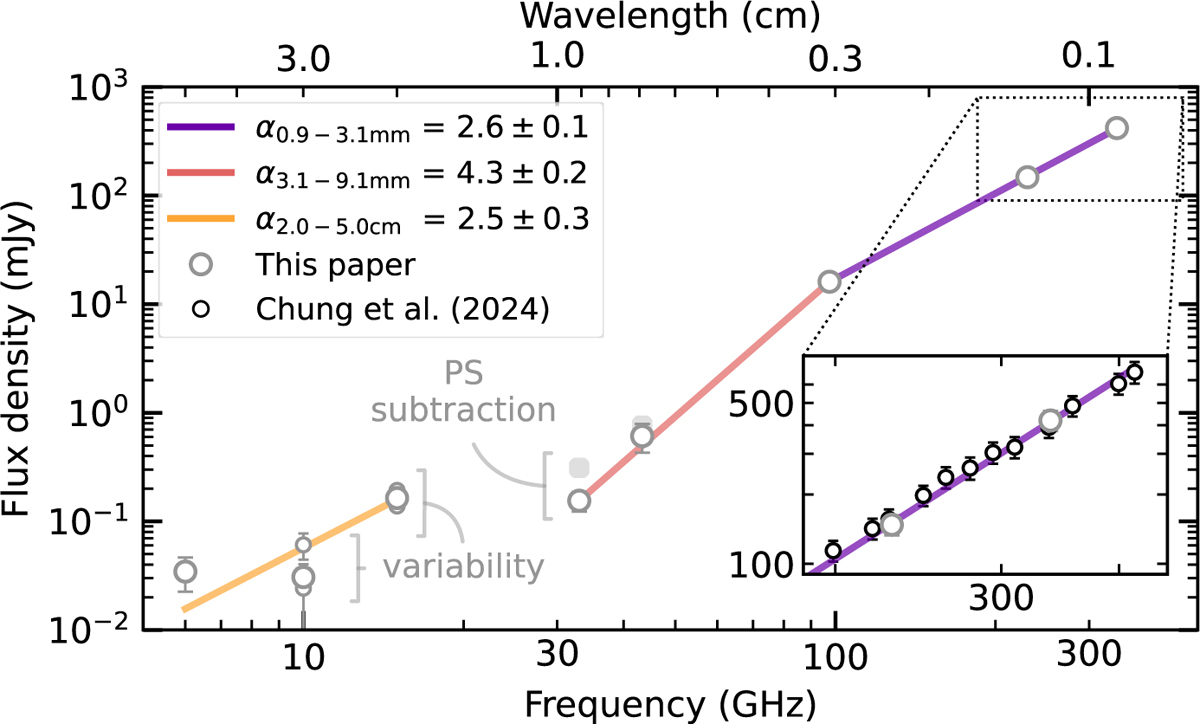
Fig. 2
Download original image
CI Tau’s spectral flux density distribution. The grey dots display CI Tau’s photometry from this paper’s data and those of Rodmann et al. (2006). Photometry by Chung et al. (2024) is over-plotted with black dots in the insert. Full markers show the total flux density (i.e. before point-source subtraction) for the ALMA Band 3 and the VLA Q and Ka band data. The maximum and minimum integrated flux densities across different scans are displayed as smaller dots for the Ku and X band data to highlight their short timescale variability.
Current usage metrics show cumulative count of Article Views (full-text article views including HTML views, PDF and ePub downloads, according to the available data) and Abstracts Views on Vision4Press platform.
Data correspond to usage on the plateform after 2015. The current usage metrics is available 48-96 hours after online publication and is updated daily on week days.
Initial download of the metrics may take a while.