Fig. 3
Download original image
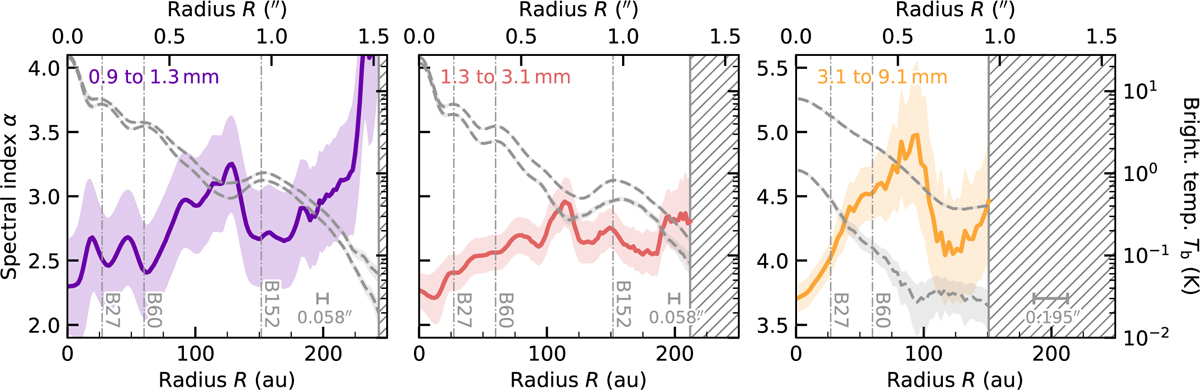
Spectral index radial profiles (solid lines) and their 1σ uncertainty (shaded areas). The hatched regions mark those locations where S/N ≤ 5 (left and central panel) and 3 (right panel), for at least one of the emission profiles. The dashed grey lines in each panel display the surface brightness radial profiles combined to determine the spectral index.
Current usage metrics show cumulative count of Article Views (full-text article views including HTML views, PDF and ePub downloads, according to the available data) and Abstracts Views on Vision4Press platform.
Data correspond to usage on the plateform after 2015. The current usage metrics is available 48-96 hours after online publication and is updated daily on week days.
Initial download of the metrics may take a while.