Fig. 4
Download original image
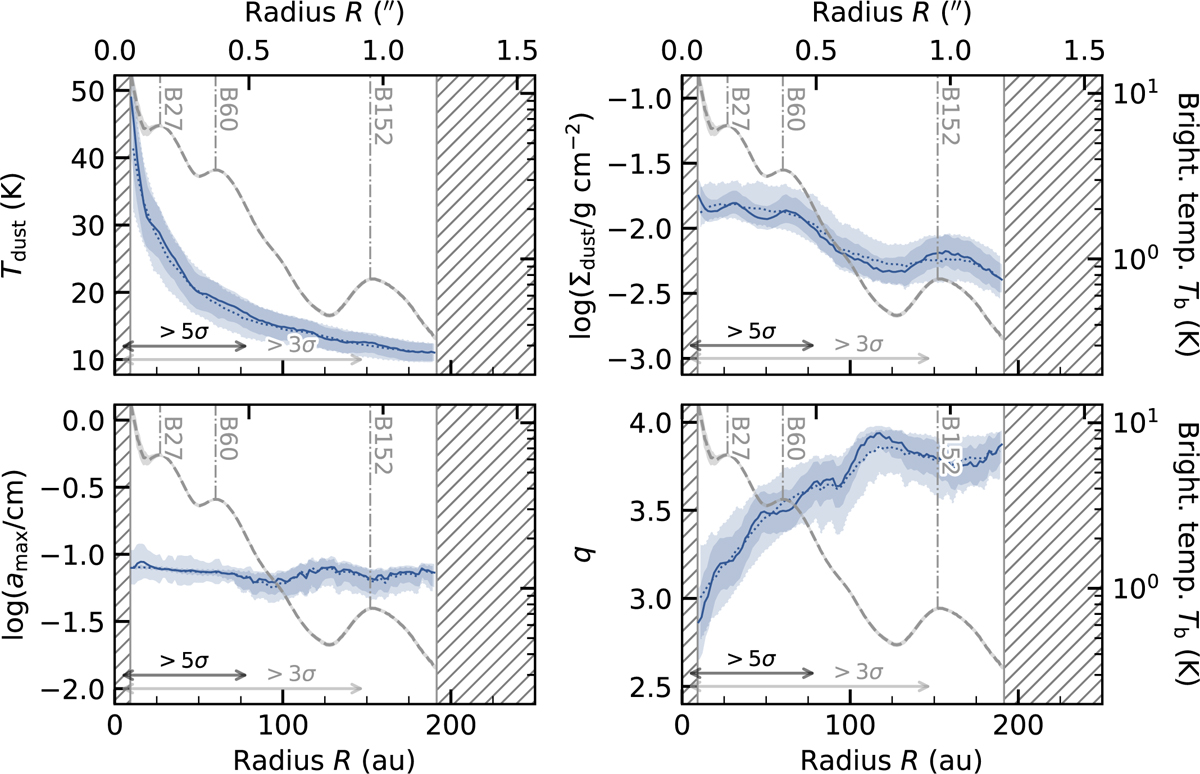
Dust temperature, density, maximum size, and density distribution power-law index posterior distributions for our fiducial ‘Ricci (compact)’ composition. The blue solid lines and shaded regions display the median and 1σ uncertainty of each parameter. For comparison, the dotted lines show the results of the low resolution fit. The hatched areas mark the disc region within the synthesised beam minor axis (![]() ) and, in the outer disc, the region where our fit does not provide robust results due to the low S/N of the data. The grey dashed line displays our ALMA Band 6 surface brightness radial profile (at a resolution of
) and, in the outer disc, the region where our fit does not provide robust results due to the low S/N of the data. The grey dashed line displays our ALMA Band 6 surface brightness radial profile (at a resolution of ![]() ), the bright ring position is indicated and labelled as in the previous plots. The black and grey horizontal arrows mark the regions where the S/N of VLA Ka band surface brightness radial profile is >5 and 3.
), the bright ring position is indicated and labelled as in the previous plots. The black and grey horizontal arrows mark the regions where the S/N of VLA Ka band surface brightness radial profile is >5 and 3.
Current usage metrics show cumulative count of Article Views (full-text article views including HTML views, PDF and ePub downloads, according to the available data) and Abstracts Views on Vision4Press platform.
Data correspond to usage on the plateform after 2015. The current usage metrics is available 48-96 hours after online publication and is updated daily on week days.
Initial download of the metrics may take a while.