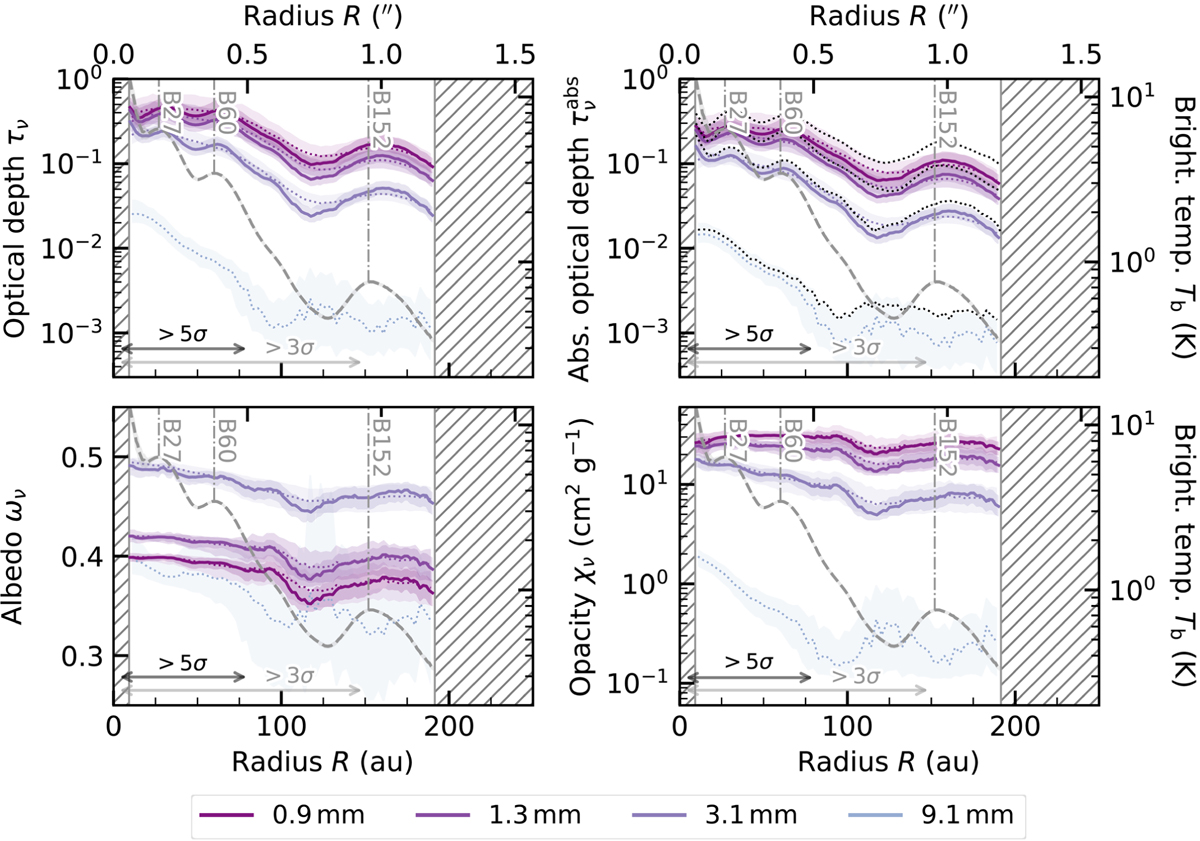
Fig. 5
Download original image
Optical depth, absorption optical depth, albedo, and total dust opacity posterior distributions at 0.9, 1.3, 3.1, and 9.1 mm for our fiducial ‘Ricci (compact)’ composition. The solid lines and shaded regions display the median and 1σ uncertainty of each parameter. For comparison, the dotted lines show the results of the low resolution fit. The black dotted lines display the absorption optical depth estimated at each wavelength separately in the optically thin approximation from Equation (10). Our ALMA Band 6 surface brightness radial profile is plotted with grey dashed lines, the bright ring position is indicated and labelled as in the previous plots. The black and grey horizontal arrows mark the regions where the S/N of VLA Ka band surface brightness radial profile is >5 and 3. Dust emission is marginally optically thin at all the wavelengths.
Current usage metrics show cumulative count of Article Views (full-text article views including HTML views, PDF and ePub downloads, according to the available data) and Abstracts Views on Vision4Press platform.
Data correspond to usage on the plateform after 2015. The current usage metrics is available 48-96 hours after online publication and is updated daily on week days.
Initial download of the metrics may take a while.