Fig. 7
Download original image
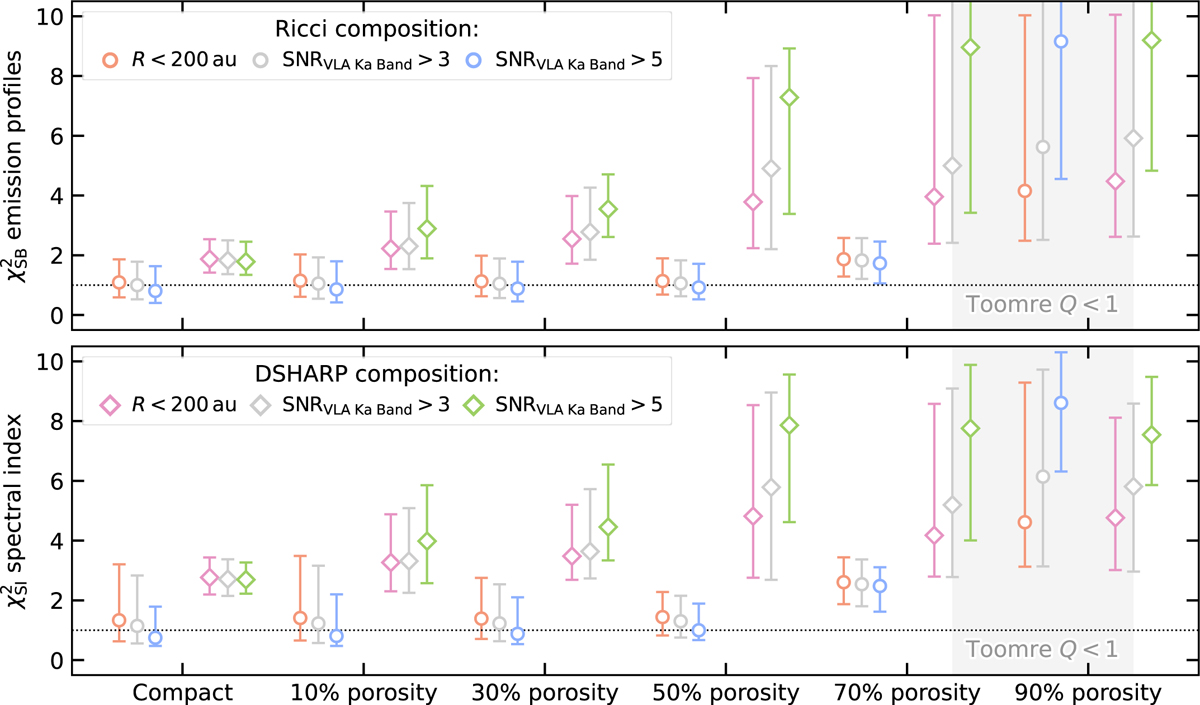
Reduced χ2 between our model posteriors and the observed surface brightness (upper panel) and spectral index (bottom panel) radial profiles for different porosity fractions, colour-coded by the outermost disc radius the χ2 was averaged over. Dots and diamonds are used for the ‘Ricci’ and ‘DSHARP’ mixtures, respectively. The shaded grey regions indicate where the inferred dust surface density is high enough for the disc to be in the marginally gravitational unstable regime under the assumption of a standard dust-to-gas ratio Z = 10−2. The ‘Ricci’ mixture provides better fits than the ‘DSHARP’ one for every porosity level and suggests that dust in CI Tau can be up to 50% porous. The ‘DSHARP’ mixture, instead, can explain the data only for compact aggregates.
Current usage metrics show cumulative count of Article Views (full-text article views including HTML views, PDF and ePub downloads, according to the available data) and Abstracts Views on Vision4Press platform.
Data correspond to usage on the plateform after 2015. The current usage metrics is available 48-96 hours after online publication and is updated daily on week days.
Initial download of the metrics may take a while.