Fig. 8
Download original image
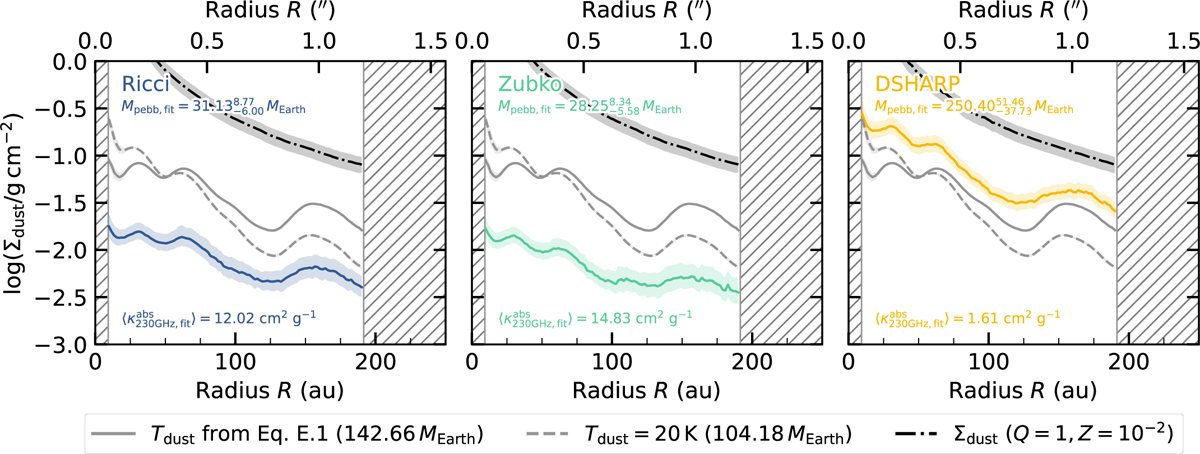
Comparison between the pebble masses (top-left corner, within R < 200 au) inferred from the dust surface density radial profiles fitted using different compositions (for compact grains only). The solid and dashed grey lines display the expected dust surface density radial profiles obtained by converting the ALMA Band 6 surface brightness radial profile using a constant temperature of 20 K and the temperature profile from Equation (E.1), both for κ230 GHz = 2.3 cm2 g−1. The median absorption opacity from our multi-wavelength fit for different dust mixtures is annotated in the bottom-left corner of each subplot. The dashed-dotted black line shows the upper limit on the dust surface density, corresponding to a Toomre parameter Q = 1 and a gas-to-dust ratio Z = 10−2.
Current usage metrics show cumulative count of Article Views (full-text article views including HTML views, PDF and ePub downloads, according to the available data) and Abstracts Views on Vision4Press platform.
Data correspond to usage on the plateform after 2015. The current usage metrics is available 48-96 hours after online publication and is updated daily on week days.
Initial download of the metrics may take a while.