Open Access
Fig. 8
Download original image
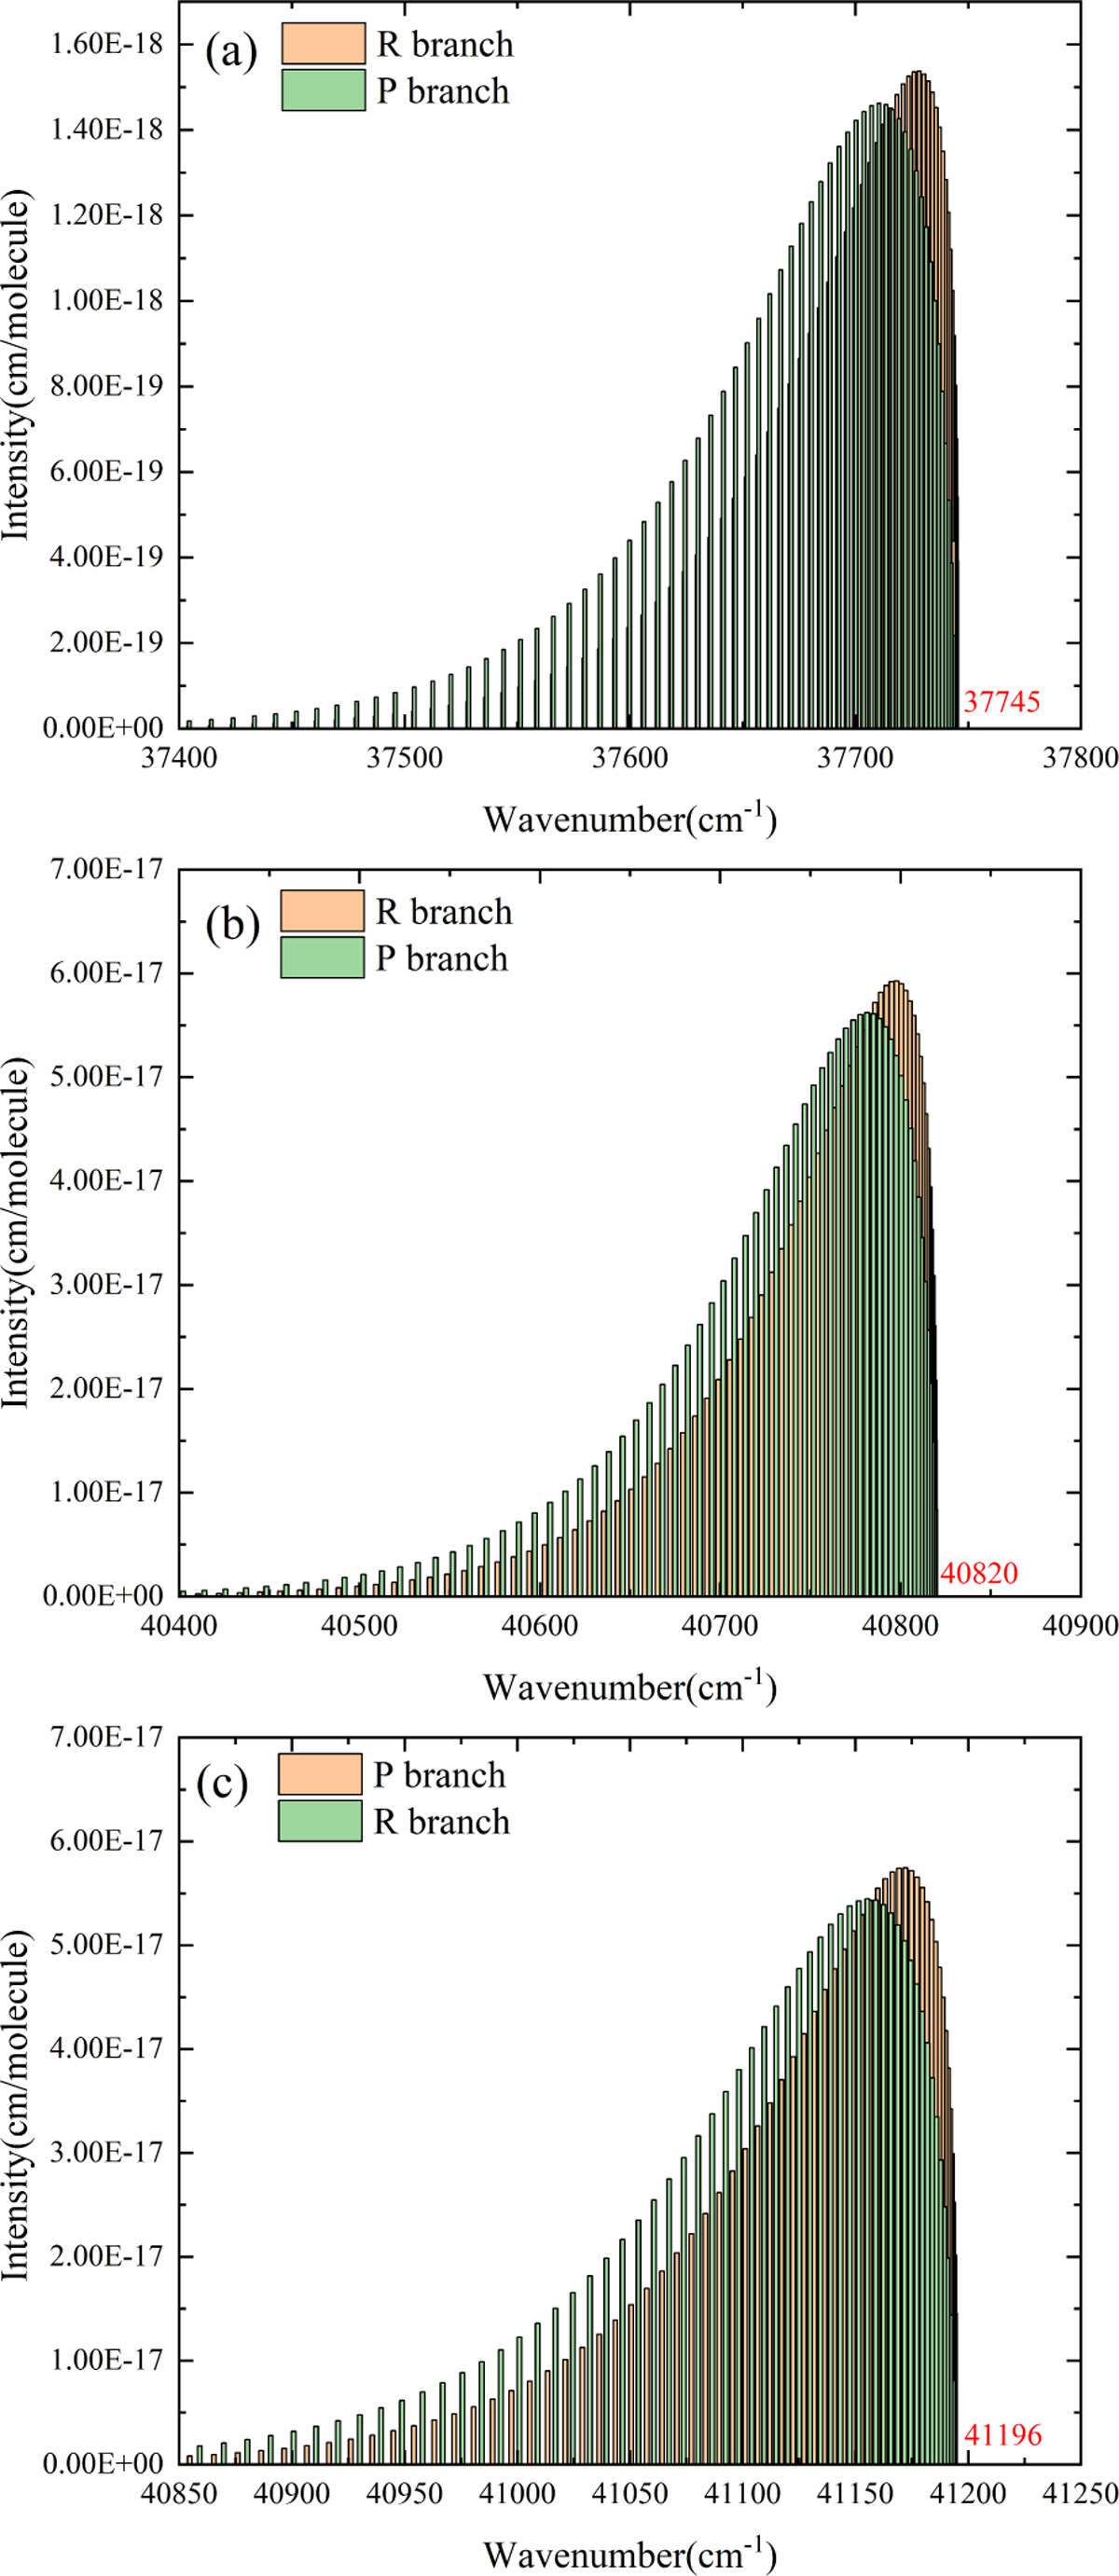
Simulated rotational P and R branches in the chosen vibronic band spectra for the f1Δu ←a1Δg transition: 4–1 band (a), 10-0 band (b), and 11-0 band (c). A rotational temperature of 300 K is used in the spectral modeling.
Current usage metrics show cumulative count of Article Views (full-text article views including HTML views, PDF and ePub downloads, according to the available data) and Abstracts Views on Vision4Press platform.
Data correspond to usage on the plateform after 2015. The current usage metrics is available 48-96 hours after online publication and is updated daily on week days.
Initial download of the metrics may take a while.