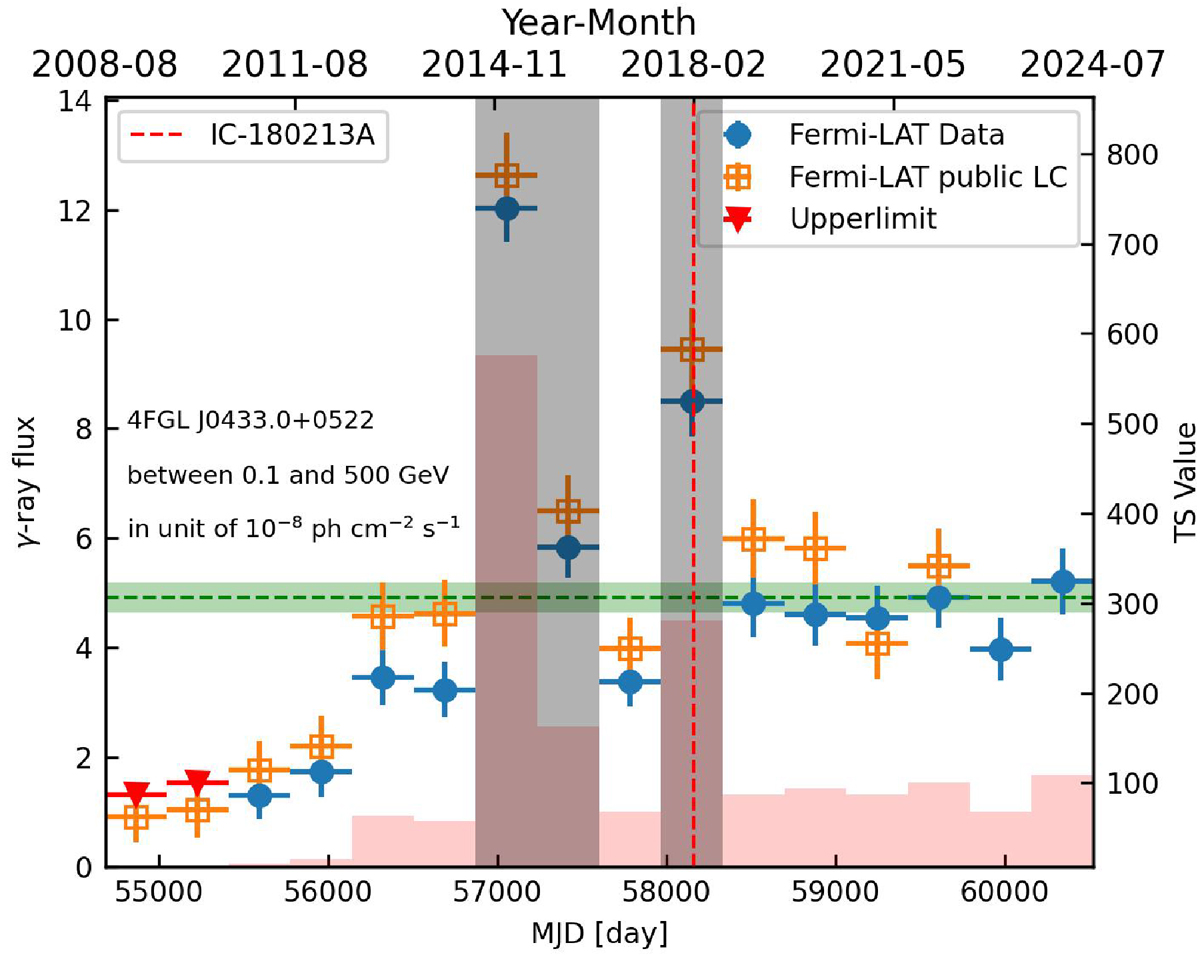
Fig. 2.
Download original image
One-year time bin γ-ray light curve of 4FGL J0433.0+0522. The blue circles and red triangles correspond to flux estimations and upper limits, with TS values indicated by red bars. The orange hollow squares represent data from the Fermi-LAT public light curve. The gray shaded region shows the epoch of high-state γ-ray flux by Bayesian block analyses, and the green shaded region marks the 16-year averaged γ-ray flux. The red vertical dashed line marks the arrival time of IC-180213A.
Current usage metrics show cumulative count of Article Views (full-text article views including HTML views, PDF and ePub downloads, according to the available data) and Abstracts Views on Vision4Press platform.
Data correspond to usage on the plateform after 2015. The current usage metrics is available 48-96 hours after online publication and is updated daily on week days.
Initial download of the metrics may take a while.