| Issue |
A&A
Volume 702, October 2025
|
|
|---|---|---|
| Article Number | A129 | |
| Number of page(s) | 9 | |
| Section | Extragalactic astronomy | |
| DOI | https://doi.org/10.1051/0004-6361/202453146 | |
| Published online | 15 October 2025 | |
A nearby FR I type radio galaxy (3C 120) as a possible PeV neutrino emitter
1
Department of Physics and Astronomy, College of Physics, Guizhou University, Guiyang 550025, People’s Republic of China
2
Key Laboratory of Dark Matter and Space Astronomy, Purple Mountain Observatory, Chinese Academy of Sciences, Nanjing 210023, People’s Republic of China
3
School of Astronomy and Space Science, University of Science and Technology of China, Hefei, Anhui 230026, People’s Republic of China
⋆ Corresponding authors: This email address is being protected from spambots. You need JavaScript enabled to view it.
; This email address is being protected from spambots. You need JavaScript enabled to view it.
Received:
25
November
2024
Accepted:
8
August
2025
Abstract
Although connections between flaring blazars and some IceCube neutrinos have been established, the dominant sources for the bulk extragalactic neutrino emissions are still unclear, and one widely suggested candidate is a population of radio galaxies. Because of their relatively low γ-ray radiation luminosities (Lγ), it is rather challenging to confirm such a hypothesis with the association between an incoming neutrino and a GeV γ-ray flare. Here, we report on the search for the GeV γ-ray counterpart of the neutrino IC-180213A and show that the nearby (z = 0.03) broad-line radio galaxy 3C 120 is the only known co-spatial GeV γ-ray source in a half-year epoch around the neutrino detection. An intense γ-ray flare, the second strongest one among the entire 16-year period, is temporally coincident with the detection of IC-180213A. Moreover, accompanying optical brightenings in the g band and V band are observed. We also find that the 3C 120, as a possible neutrino emitter, follows the Lγ-DL2 correlation for the neutrino sources (candidates), including NGC 1068 and some blazars. These facts suggest that 3C 120 is a candidate for emitting high-energy neutrinos and may offer initial evidence of the radio galaxy origin of some PeV neutrinos.
Key words: neutrinos / galaxies: active / galaxies: jets / gamma rays: galaxies
© The Authors 2025
 Open Access article, published by EDP Sciences, under the terms of the Creative Commons Attribution License (https://creativecommons.org/licenses/by/4.0), which permits unrestricted use, distribution, and reproduction in any medium, provided the original work is properly cited.
This article is published in open access under the Subscribe to Open model. This email address is being protected from spambots. You need JavaScript enabled to view it. to support open access publication.
1. Introduction
Neutrinos, which interact weakly with matter, can escape from extreme astrophysical environments that are impenetrable to electromagnetic radiation and hence provide unique insights into these intriguing astrophysical environments. The IceCube neutrino observatory at the South Pole1 has discovered some high-energy neutrinos of astrophysical origin (e.g., IceCube Collaboration 2013, 2023; Aartsen et al. 2015). These neutrinos were produced through the interaction of ultra-high-energy cosmic rays (UHECRs) with ambient matter (i.e., p-p) or radiation fields (i.e., p-γ); hence, they are crucial for revealing the origin of the UHECRs. The production of such neutrinos would generate electromagnetic radiations (particularly γ-ray photons) as well. The proposed γ-ray emitters for extragalactic high-energy neutrinos include the blazars (Atoyan & Dermer 2001), starburst galaxies (Loeb & Waxman 2006), radio galaxies (Becker Tjus et al. 2014), and galaxy clusters (Murase et al. 2008). The association between neutrino events and γ-ray activities is a powerful tool for probing the origin of the IceCube events. So far, the blazar TXS 0506+056 and very nearby Seyfert II galaxy NGC 1068 have been confirmed to be the sources of the TeV-PeV neutrinos (IceCube Collaboration 2018a, 2022).
The advantage of a connection established between a flaring blazar and an incoming neutrino is that both the spatial and temporal information can be utilized. Similar cases with that a physical connection between TXS 0506+056 and IceCube-170922A are established, are mounting (e.g., Kadler et al. 2016; Garrappa et al. 2019; Giommi et al. 2020; Franckowiak et al. 2020; Liao et al. 2022; Sahakyan et al. 2023; Jiang et al. 2024). However, the fraction of the contribution from blazars to the total observed neutrino flux is thought to be limited, since no significant cumulative neutrino excesses are found from the Fermi blazar directions (Aartsen et al. 2017).
The jets of active galactic nuclei (jetted AGNs) are the dominant population of the extragalactic γ-ray sky, in which majority of them are blazars (Ballet et al. 2023). Having benefited from the strongly Doppler-boosted effect due to the well-aligned relativistic jets, the broadband nonthermal emissions of blazars are overwhelming and highly variable (Blandford & Rees 1978; Ulrich et al. 1997; Blandford et al. 2019). By comparison, radio-loud AGNs with misaligned jets (MAGN), including radio galaxies and steep spectrum radio quasars, are characterized by steep radio spectra as well as bipolar radio structures (Antonucci 1993; Urry & Padovani 1995). Although their radiations are mildly Doppler boosted, MAGNs are prominent GeV γ-ray emitters (Abdo et al. 2010a; Ajello et al. 2022). A few MAGNs are even shining in the TeV γ-ray sky (e.g., Aharonian et al. 2003, 2009; Aleksić et al. 2012). Nearby radio galaxies have been considered as promising UHECR emitters (Rieger 2022).
Recently, the IceCube Event Catalog of Alert Tracks (i.e., ICECAT-1) has been released (Abbasi et al. 2023). A 0.111 PeV track-like neutrino event (i.e., IC-180213A, a so-called bronze event), in an arrival direction event of RA  and Dec
  2 (at a 90% confidence level), is reported in ICECAT-1. Interestingly, a nearby Fanaroff-Riley (FR, Fanaroff & Riley 1974) I broad-line radio galaxy (BLRG), 3C 120, falls into the localization uncertainty region of the neutrino. It is a well-studied nearby source with z = 0.033 (Burbidge 1967), ≃145 Mpc away, and hosting an efficiently accreting black hole with a mass of 5.5 × 10⁷ M⊙ according to the reverberation mapping approach (Peterson et al. 2004). Radio observations with the Very Long Baseline Array reveal super-luminal components with a median apparent speed of ≃4.7c (Lister et al. 2021), and the jet inclination angle to the line of sight is constrained to be ∼10 − 20°. Consequently, a Doppler factor of δ ∼ 2.4 and a bulk Lorentz factor of Γ ∼ 5 are suggested (Jorstad et al. 2005; Hovatta et al. 2009). 3C 120 is famous for the strong variability from radio to GeV γ rays, with which an accretion-disk-jet connection has been established (Marscher et al. 2002; Abdo et al. 2010a; Kataoka et al. 2011). In this work, we thoroughly investigated the multiwavelength data of 3C 120 to explore its potential association with the neutrino event IC-180213A. Data analyses are presented in Section 2, while discussions and a short summary are given in Section 3. We adopt a Λ cold dark matter cosmology with ΩM = 0.32, ΩΛ = 0.68, and a Hubble constant of H0 = 67 km−1 s−1 Mpc−1 (Planck Collaboration XVI 2014).
2. Data analysis and results
2.1. Fermi-LAT Data
We collected the first 16-year (i.e., MJD 54683–60443, or from 2008 August 4 to 2024 August 4) Fermi-LAT Pass 8 SOURCE data (evclass = 128 and evtype = 3). An energy range of the data was selected between 100 MeV and 500 GeV. The Fermitools software version 2.2.0 was adopted for the data analysis, along with Fermitools-data version 0.18. In the initial data-filtering procedure, a zenith angle cut (i.e., < 90°) was set to avoid significant contamination from the Earth limb; meanwhile, the recommended quality-filter cuts (i.e., DATA_QUAL= = 1 && LAT_CONFIG= = 1) were applied. An unbinned-likelihood analysis was performed by the gtlike task to extract the γ-ray flux and spectrum. We used the test statistic (TS =−2ln (L0/L); Mattox et al. 1996) to determine the significance in the γ-ray detection. L and L0 correspond to the maximum likelihood values for the models with and without the target γ-ray source, respectively. During the likelihood analysis, a region of interest (ROI) of ten degrees centered on the coordinates of 4FGL J0433.0+0522, for which the low-energy counterpart is 3C 120, was set. Parameters of background source in an incremental version (data release 4) of the fourth Fermi-LAT catalog (4FGL-DR4, Ballet et al. 2023) within the ROI, as well as those for the diffuse emission templates (i.e., gll_iem_v07.fits and iso_P8R3_SOURCE_V3_v01.txt) were left free, while other parameters were frozen as the default values. In addition, the residual TS maps were produced in which potential γ-ray sources not included in 4FGL-DR4, were checked. The model was updated by embracing these sources and the likelihood analyses were then re-performed. In the temporal analysis, weak background sources with TS < 10 were removed from the model. Meanwhile, 95% CL upper limits were obtained by the pyLikelihood UpperLimits tool to replace the flux estimations.
An analysis of the entire 16-year dataset proves that 4FGL J0433.0+0522 is a significant γ-ray source (TS ≃ 1500, 38σ). Its averaged flux is estimated as (4.9 ± 0.3) × 10−8 ph cm−2 s−1, consistent with the results listed in 4FGL-DR4 (Ballet et al. 2023). It is confirmed as a spectrally soft γ-ray source (spectral index ≃ 2.83). Our localization analysis also confirms the spatial association between 3C 120 and the γ-ray source.
Since detection of the neutrino event IC-180213A is highly time sensitive, we carried out a specific analysis on half-year Fermi-LAT data, centered at the arrival time of the neutrino (i.e., from MJD 58072 to 58252). Such a time length is consistent with the 158-day time window found in the neutrino flare toward TXS 0506+056 from 2014–2015 (IceCube Collaboration 2018b). According to the 4FGL-DR4 (Ballet et al. 2023), there are two γ-ray sources likely co-spatial with the neutrino. Besides 3C 120 (i.e., 4FGL J0433.0+0522), another source falls into the localization uncertainty region of the neutrino, 4FGL J0426.5+0517. The analysis on this specific epoch suggests that 4FGL J0426.5+0517 are undetectable for Fermi-LAT, with given TS values of < 5 (i.e., 1.7σ). On the other hand, 4FGL J0433.0+0522 is revealed as a significant γ-ray source, of which the TS value is estimated as 127 (i.e., 11σ; see Figure 1a). Its photon flux in this period is obtained as (8.1 ± 1.2) × 10−8 ph cm−2 s−1. Furthermore, a TS map with 4FGL J0433.0+0522 included in the analysis model was extracted to check whether sources not in 4FGL-DR4 emerge. As shown in Figure 1b, no such sources are found. Therefore, when the neutrino arrives, 3C 120 is the unique co-spatial γ-ray source.
The temporal behavior of 4FGL J0433.0+0522 was investigated next. Firstly, a one-year time-bin γ-ray light curve was extracted. We are aware of publicly available one-year time bin light curves from the Fermi-LAT collaboration3, which is based on summed-likelihood analyses (Abdollahi et al. 2020). Our results from the unbinned-likelihood analysis are consistent with that of the public light curve (see Figure 2). At the beginning of the Fermi-LAT operation, 3C 120 was at a low flux state. Around MJD 56000, its flux started to rise. Two distinct γ-ray flares followed the flares; this maintained a median value flux level. The variability is proven to be significant (> 5σ) by adopting the “variability-index” test (Nolan et al. 2012). Temporal behaviors of the bright nearby background sources were also investigated. No similar behaviors to those of the target are observed, and hence detections of the γ-ray flares is likely intrinsic rather than being artificial caused by the backgrounds. Moreover, the flaring epochs are identified by the Bayesian block approach with a false alarm probability of 0.05 (Scargle et al. 2013). As shown in Figure 2, the incoming time of IC-180213A (i.e., MJD 58162) coincides with a γ-ray flare of 4FGL J0433.0+0522 with a time range between MJD 57968 and 58333.
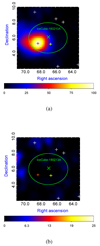 |
Fig. 1. Smoothed γ-ray TS maps (8° ×8° scale with 0.2° per pixel) based on Fermi-LAT data between MJD 58072 and MJD 58252. Panel 1a corresponds to an analysis source model without 4FGL J0433.0+0522, while in the residual TS map (i.e., panel 1b), the target is included. The green X-shaped symbol and ellipse represent optimized position and positional uncertainties of the neutrino, respectively. The red and yellow crosses are the optimized γ-ray locations of 4FGL J0433.0+0522 and 4FGL J0426.5+0517, respectively, together with the corresponding 95% C.L. γ-ray localization error radii (green circles). The white crosses represent other γ-ray sources in the 4FGL-DR4 catalog. |
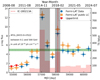 |
Fig. 2. One-year time bin γ-ray light curve of 4FGL J0433.0+0522. The blue circles and red triangles correspond to flux estimations and upper limits, with TS values indicated by red bars. The orange hollow squares represent data from the Fermi-LAT public light curve. The gray shaded region shows the epoch of high-state γ-ray flux by Bayesian block analyses, and the green shaded region marks the 16-year averaged γ-ray flux. The red vertical dashed line marks the arrival time of IC-180213A. |
A constant uncertainty light curve was also extracted by employing an adaptive-binning method. A default value of target relative flux uncertainty of 20% was set (Lott et al. 2012). The γ-ray variation is confirmed to be significant (> 5σ) through the variability index test (Nolan et al. 2012). In this case, the comparison between different flux states on a long timescale is well characterized, as is as the shape of the γ-ray flares. Based on the Bayesian block method (Scargle et al. 2013), three significant γ-ray flares were identified with the false alarm probability of 0.05. These flares, labeled as flares I, II, and III, are highlighted in Figure 3. The most intense flare is flare II, peaking at MJD 57133. Its maximum flux, (4.3 ± 0.6) × 10−7 ph cm−2 s−1, is roughly 40-fold the flux level at the initial phase of the Fermi-LAT observation around MJD 55000, (1.0 ± 0.4) × 10−8 ph cm−2 s−1. Flare III is also distinct, ranging from MJD 58109 to 58298. The peaking flux (at MJD 58290), is (2.4 ± 0.4) × 10−7 ph cm−2 s−1, which suggests a roughly 20-fold γ-ray brightening. We note that arrival time of IC-180213A is at the ascent phase of flare III, which is consistent with the findings from the yearly bin light curve. By comparison, flare I appears to be relatively mild, with flux levels up to ≃10−7 ph cm−2 s−1. In fact, the γ-ray temporal properties of 3C 120 have been extensively studied. The detections of flare I and II are consistent with the results found in a 30-day time-bin light curve (Janiak et al. 2016). Moreover, adaptive-binning light curves of 3C 120 have also been extracted (Zargaryan et al. 2017; Kramarenko et al. 2022), from which the variation trends are similar to that shown in this study. In particular, a γ-ray flux increase is also revealed at the arrival time of IC-180213A (Kramarenko et al. 2022).
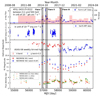 |
Fig. 3. Multiwavelength light curves of 3C 120. The panels from top to bottom are the adaptive-binning Fermi-LAT γ-ray light curve, the 1 keV light curve from Swift-XRT, the ASAS-SN weekly binned light curves, the NEOWISE light curves, and the multifrequency radio light curves from RATAN-600, respectively. The three shaded gray regions correspond to the time periods of γ-ray flares, while the red dashed vertical line represents the neutrino arrival time. |
Furthermore, individual analyses of these three flares were performed. The corresponding results are summarized in Table 1. No significant differences of the spectral indexes between these flares are found. Since the spectral index of 4FGL J0433.0+0522 listed by the 4FGL-DR4 is 2.79 ± 0.03 (Ballet et al. 2023), no clear spectral hardness is indicated for the flares. Localization analyses suggest that during the flare epochs 3C 120 is co-spatial with the γ-ray source. Unlike blazars, detections of fast variability from MAGNs are not preferred due to the mild relativistic effect. However, occasionally, a few radio galaxies (e.g., IC 310, Aleksić et al. 2014; NGC 1275, Baghmanyan et al. 2017) are notable for possessing such extreme observational phenomena. For 3C 120, interestingly, detections of intraday γ-ray variability from 2014–2015 (i.e., flare I and flare II in our study) have been claimed (Janiak et al. 2016). This was confirmed in the following study of Zargaryan et al. (2017). Motivated by these findings, we also extracted a one-day time-bin γ-ray light curve focusing on the epoch of flare III to search for potential fast variability (see Figure 4a). A threefold flux rise within one day, from (2.1 ± 0.7) × 10−7 ph cm−2 s−1 at MJD 58191 to (6.5 ± 1.0) × 10−7 ph cm−2 s−1 at MJD 58192, is observed. The TS values of the two detections are 12 (3.4σ) and 98 (10σ), respectively. We note that the flux level at MJD 58192 is approximately 13 times the 16-year averaged flux. Based on these detections, the corresponding doubling timescale in the AGN frame is given as τdoub, AGN = Δt × ln2/ln(F1/F2)/(1 + z)≲15 hours.
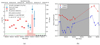 |
Fig. 4. Zoomed-in view of γ-ray and optical light curves. Left panel: Fermi-LAT one-day time bin γ-ray light curve during the period from MJD 58179 to 58199. The gray data points indicate time bins with no Fermi-LAT exposures. The 16-year averaged γ-ray flux is also plotted on the green horizontal line, as is its uncertainty. Right panel: ASAS-SN light curves in the V and g bands at a time range between MJD 58100 and 58360. |
2.2. Swift-XRT Data
3C 120 is a well-studied bright X-ray source (e.g., Marscher et al. 2002). In particular, there are more than 200 visits from the X-ray Telescope aboard the Neil Gehrels Swift Observatory (Gehrels et al. 2004; Burrows et al. 2005). Interestingly, one Swift observation on MJD 58196 (ObsID: 00037594050, exposure time of ≃1 ks) about one month after the arrival of the neutrino, was performed. The XRT photon counting mode data of this observation were analyzed with the FTOOLS software version 6.33.2. After the xrtpipeline event cleaning by the standard quality cuts, spectra from the target and the background were extracted by the xselect task. To deal with the pile-up effect, an annular region with an inner radius of 5 pixels and an outer one of 20 pixels was adopted for the source, while a circle with a radius of 60 pixels in a blank area was set for the background. Then, the ancillary response files were generated by the response matrix files taken from the calibration database. The spectrum was re-binned so that each bin has at least 20 photons. Channels with energy levels below 0.5 keV were excluded, and the absorption column density was set as the Galactic value (i.e., 1021 cm−2). Fitting the spectrum by xspec suggests an unabsorbed 0.5–10.0 keV flux of  10−11 erg cm−2 s−1 (χ2/d.o.f., 19.2/16), as well as a hard x-ray spectrum of Γx = 1.52 ± 0.15.
The long-term X-ray light-curve data were derived from the results from analyses by the swift_xrtproc script (Giommi et al. 2021)4, in which standard data reduction procedures, corrections for pile-up effect, and spectral fitting analyses were employed. Our results for the XRT observation on MJD 58196 are consistent with that given by the swift_xrtproc script. As shown in Figure 3, the X-ray flux level is moderate at that time.
2.3. ASAS-SN data
Optical light-curve data were obtained by the All-Sky Automated Survey for Supernovae (ASAS-SN; Shappee et al. 2014; Kochanek et al. 2017; Hart et al. 2023)5. V-band and g-band magnitudes, extracted by photometry and calibrated by the AAVSO Photometric All-Sky Survey (Henden et al. 2012), from different cameras were adopted. Only frames flagged with “G” quality were selected. The exposures were binned into weekly time-bin light curves to exhibit the long-term flux temporal behavior. As shown in Figure 3, the optical emissions of 3C 120 are highly active, with variability amplitudes ≳0.5 mag, which is consistent with the results in the literature (e.g., León-Tavares et al. 2010). There are simultaneous ASAS-SN observations: from the V band at MJD 58161 and g band at 58160, during the arrival of the neutrino (i.e., MJD 58162). A zoomed-in view of the optical light curves from MJD 58100 to MJD 58360 is shown as Figure 4b. A χ2-test that its null hypothesis is a constant flux level was adopted to investigate the significance of the variability. By varying the constant flux level, minimum χ2 values of the V-band (χ2/d.o.f., 453/13) and the g-band (χ2/d.o.f., 1795/17) light curves are obtained; hence, the variability is suggested to be significant (> 5σ). In particular, a brightening of 0.27 mag in the V band, from 14.31 ± 0.02 mag at MJD 58176 to 14.04 ± 0.03 mag at MJD 58328, is detected. Meanwhile, a similar behavior whereby the g-band flux rises from 14.53 ± 0.01 mag at MJD 58180 to 14.22 ± 0.01 mag at MJD 58314 is also found. Since the flux increases are markedly larger than the measurement uncertainties,  , the brightenings are likely intrinsic rather than due to the fluctuation. However, there are no simultaneous ASAS-SN observations when the γ-ray flux reaches the maximum value (i.e., MJD 58290). The temporal relationship between these two bands cannot be well constrained.
2.4. WISE data
Single-exposure photometric data in the W1 and W2 bands (centered at 3.4 and 4.6 μm in the rest frame) from the Wide-field Infrared Survey Explorer (WISE; Wright et al. 2010) and the near-Earth object WISE (NEOWISE) Reactivation mission (Mainzer et al. 2020; WISE Team 2020) were collected. Data with poor image quality (“qi_fact” < 1), in close proximity to the South Atlantic anomaly (“SAA” < 5), and flagged for moon masking (“moon mask” = 1) were filtered out (Jiang et al. 2021). We grouped the data for each observational epoch (see Figure 3), separated by approximately half a year, using the weighted mean value. The corresponding uncertainty was determined by propagation of the measurement errors. An investigation based on a χ2-test statistic analysis (for more details, see Liao et al. 2019) suggests significant long-term variability (> 5σ). The variability amplitude is up to ≃0.3 mag. One flux maximum is distinct at MJD 57264. A continuous flux increase is exhibited in recent years, and the flux is at a high level right now. There are WISE observations of MJD 58154, about eight days before the detection of the neutrino. The infrared fluxes at that time are at a relatively low flux state.
2.5. RATAN-600 data
Additional radio data were collected from observations from RATAN-600, a 600-meter circular multi-element antenna that is capable of measuring broadband spectra across the 1–22 GHz range simultaneously (Parijskij 1993), since 3C 120 has been included in the RATAN-600 multi-frequency monitoring list for jetted AGNs6 (Mingaliev et al. 2014; Sotnikova et al. 2022). As shown in Figure 3, the centimeter radio fluxes are variable, especially at 21.7/22.3 GHz, where the flux density at MJD 57457 (4.5 ± 0.6 Jy) is three times of that at MJD 56731 (1.3 ± 0.2 Jy). RATAN-600 observations at 21.7/22.3, 11.2 and 4.8 GHz were performed on MJD 58156 about six days before the detection of IC-180213A. The measured flux densities are relatively low.
2.6. Implications of multi-messenger observations
The broadband temporal behaviors, shown in Figure 3, strongly suggest that the activities of the relativistic jet are distinct from radio wavelengths in the high-energy γ-ray regime; although, as a MAGN, the Doppler effect of 3C 120 is assumed to be relatively low. In particular, the variability in the GeV γ-ray domain is more violent than that on optical anc infrared wavelengths, and in the latter case, contributions from the accretion disk and the host galaxy are also likely significant. Since three flares have been identified in the γ-ray light curve, the temporal behaviors at other radiation windows were examined. For flare III, in its initial phase of the flux rise when the neutrino event IC-180213A is detected, the brightening of the optical fluxes in both the g band and V band were followed. However, no observations in the X-ray and infrared around the peaking time of flare III are available. Although the variability amplitude of flare I is moderate, at the same time a strong rapid X-ray flare appears.
The multiwavelength electromagnetic observations play an important role in the investigation of origin of the neutrino event IC-180213A. The aforementioned evidence includes that in a half-year epoch centered at the arrival time of the neutrino, 3C 120 is the unique known co-spatial γ-ray source. In addition, the incoming of IC-180213A temporally coincides with the second strongest γ-ray flare throughout the 16 years’ of observations, for which a 20-fold flux increase is found. Accompanying optical flux increases are also detected. All these observational facts suggest a physical link between IC-180213A and 3C 120.
Further Monte Carlo simulations were conducted to estimate the chance probability corresponding to the multi-messenger detections. The central position of IC-180213A was randomized across the sky by fixing the size of the localization error area (Abbasi et al. 2023). Since the detection sensitivity of IceCube is highly dependent on the sky declination, only the RA value was left free. Since the neutrino (b < −26°) is away from the Galactic plane, it is unlikely from the Galactic sources (Gagliardini et al. 2024; Fang et al. 2024). Therefore, during the simulation, the Galactic plane region at this sky declination was excluded; that is, about 10% of the total considered area. Known γ-ray sources, showing an outburst when IC-180213A arrived, were searched in the simulation. Based on the public one-year time bin Fermi-LAT light curves, only sources with significant variability (p > 99%, Abdollahi et al. 2020) were selected. An additional criterion is that they should be abundantly detected (TS > 25) by Fermi-LAT at the point when the neutrino arrived (i.e., the tenth time bin of the Fermi-LAT light curves). The selections yield 21 sources, and extractions of their adaptive-binning light curves were performed. Considering that a threefold flux increase compared to the long-timescale averaged flux level is usually adopted to define a major flare (e.g., Abdo et al. 2011), the three sources TXS 0506+056, GB6 J0922+0433, and TXS 1421+048 were picked out. The chance probability is calculated as  , where N represents the total number of times of simulations (i.e., 104), and M denotes the number of cases for which temporally coincident (but not co-spatial) sources fall within the simulated uncertainty region. Under this circumstance, p ≃ 0.04 is yielded; hence, 3C 120 is suggested as a possible neutrino emitter. However, we note that the calculated significance is a posteriori and should be considered informative rather than definitive. Moreover, in order to check whether the exclusion of the low galactic latitude sources could influence the probability, their γ-ray temporal properties have been investigated. There are 4FGL-DR4 sources in this direction in total 37, in which only three ones exhibit significant long-term variability and none possessed a clear flux rise when the neutrino arrived. Therefore, the estimated probability holds whether the galactic plane region is excluded or not.
Since 3C 120 is one of a few nearby bright γ-ray radio galaxies, investigations of the origin of its high-energy emission have been carried out. A time lag of dozens of days between the γ-ray and 43 GHz radio light curves suggests that the γ-ray emission region is sub-parsec scales from the supermassive black holes (SMBHs), and synchrotron self-Compton processes (SSC) provide a good description of the γ-ray emissions (e.g., Sahakyan et al. 2015; Tanaka et al. 2015). On the other hand, observed fast intra-day γ-ray variability indicates a deeply embedded emission region in the flaring epochs (∼0.002 pc, Janiak et al. 2016), and external Compton processes cannot be ruled out (e.g., Zargaryan et al. 2017). The previous studies are based on multiwavelength data from 2012 to 2015. As part of our work, we were able to use newly available information. Taking the 15-hour doubling time in flare III as an example, the radius of the radiation region is constrained as r < cδτdoub, AGN ≈ 0.0013 pc, where a Doppler-boosting factor of δ = 2.4 was adopted (Jorstad et al. 2005). Under a conical jet geometry, the distance between the radiation region and the central SMBH is suggested as rb = Γr ≲ 0.007 pc, where Γ is taken to be 5 (Jorstad et al. 2005). Meanwhile, the time lag measured in the reverberation mapping observations between the emission lines and the continuum radiations is given as ≃28 light days (Pozo Nuñez et al. 2014), indicating that the broad-line region (BLR) is ∼0.02 pc away from the central SMBH. Therefore, in flare III, the jet radiation region is likely within the BLR. It is also worth noting that the most energetic photons of 3C 120 at energies of a few GeVs (see Table 1). The possible absorption by UV photons from the BLR could explain the absence of γ rays with energy levels of tens of GeVs (Poutanen & Stern 2010).
The spectral energy distribution (SED) of 3C 120 is drawn in Figure 5, where a typical two-bump shape is exhibited. Thanks to multiwavelength time-domain observations, (quasi)simultaneous detections (i.e., within one week) in radio, infrared, and optical bands are available, coinciding with the arrival of the neutrino event. Additionally, archival non-simultaneous data (Chang et al. 2020) are included as background for comparison. The (quasi)simultaneous SED reveals that the γ-ray emission is elevated compared to the 16-year averaged measurement, while flux levels in other wavebands appear moderate. The synchrotron peak frequency of 3C 120 is constrained to νs ≃ 1013 Hz, which suggests it is a low-synchrotron-peaked source (Abdo et al. 2010b).
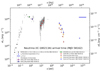 |
Fig. 5. Broadband SED of 3C 120 quasi-simultaneous data are displayed in color. The horizon line indicates the energy-averaged neutrino energy flux over a six-month duration. In contrast, the X-shaped symbols denote theoretical expectations of neutrinos. Non-simultaneous archival data are in gray. |
The frequency of the synchrotron emission can be derived as,  , where γ is the energy of emitting electrons, νsyn, jet is in the jet co-moving frame, and νsyn, obs is in the observational frame (Ghisellini 2013). Assuming that the emitting electrons follow a broken power-law distribution, the electrons at the spectral breaking energy (i.e., γb) are expected to significantly contribute emission at the synchrotron peak. Therefore, the magnetic-field strength is constrained as B′=νsyn, obs(1 + 0.033)/(3.7 × 106γb2δ) (Tavecchio et al. 1998). By setting γb = 103, which is consistent with values used in literature (e.g., Tanaka et al. 2015; Janiak et al. 2016), and adopting δ = 2.4, the magnetic-field strength is implied as ∼1 Gauss. We note that in addition to the synchrotron emission the electrons are responsible for the γ-ray emissions, which likely vary quickly. The estimated magnetic-field strength corresponds to the compact jet blob. However, given its soft γ-ray spectrum and the lack of hard X-ray data, the peak frequency of the high-energy bump cannot be well constrained. As mentioned above, the radiation mechanisms responsible for the γ-ray emissions of 3C 120 are still unclear. Moreover, if multi-messenger information is needed, thorough lepto-hadronic radiation theoretical calculations should be performed, which is beyond the scope of this work. Nevertheless, it is agreed that leptonic processes are mainly responsible for the production of the γ-ray radiation of 3C 120. The leptonic scenario gives a natural explanation for the quasi-simultaneous flux increase of the optical and γ-ray bands in 2018 (for a similar case, see Liao et al. 2014). However, if the neutrino is indeed from the 3C 120, a secondary hadronic component in the γ-ray regime, especially in flare III of our study, should also be considered.
3. Discussions and summary
According to the detection of IC-180213A, a constraint on the neutrino luminosity of 3C 120 can be given. The number of (anti-)muon neutrinos at a declination, δ, detected by IceCube over a time period, ΔT, is expressed as
 (1)
(1)
The energy range of the neutrino population is set between  and
and  , where detections of 90% of neutrinos in the γ-ray follow-up (GFU) channel are expected (Oikonomou et al. 2021). The neutrino spectrum is characterized by a power-law distribution,
  , with an index of γ = 2. Meanwhile,
  represents the differential muon neutrino flux. In a GFU_Bronze type event (i.e., IC-180213A), the corresponding effective area is approximately Aeff ≈ 16 m2 (Abbasi et al. 2023). For the integrated time ΔT, we take a duration of half a year when the γ-ray emission is at a high flux level, identified by a Bayesian-blocks analysis of the adaptive-binning light curve. In principle, a scenario of injections of fresh relativistic particles into the radiation zone is usually used to interpret the activities of AGN jets. The short radiative cooling time of electrons leads to significant electromagnetic radiation outputs; meanwhile, an accompanying rise of neutrino flux by the accelerated protons are also expected (e.g., Halzen & Kheirandish 2016; Petropoulou et al. 2016; Murase et al. 2018; Kreter et al. 2020). Therefore, the integrated muon neutrino energy flux is calculated as approximately 2.4 × 10⁻¹⁰ erg cm−2 s−1. Considering the proximity of 3C 120, the integrated muon neutrino luminosity is obtained as
  , or, alternatively, an average muon neutrino luminosity of
  .
.
In this work, the photo-pion production ( ) is taken as the responsible mechanism to the neutrino production. The energy in the cosmic rest frame for IC-180213A is
  7. Hence, the energy of the emitting proton in the co-moving frame is at
  . When the meson production is dominated by the Δ-resonance and direct pion production, the energy of the targeting photons in the co-moving frame is suggested as
  (Murase et al. 2018). If the photons are external to the jet, the corresponding photon energy in the cosmic rest frame is given as
  . Considering that 3C 120 is defined as a BLRG and its accretion-disk emission is luminous,
 ![Mathematical equation: $ {\sim} 9\lambda L\lambda[5100\,\AA] \sim 1.3\times 10^{45} $](/articles/aa/full_html/2025/10/aa53146-24/aa53146-24-eq20.gif) erg s−1 (Peterson et al. 2004), the UV photons from the BLR likely act as the soft photons for the photo-pion processes.
erg s−1 (Peterson et al. 2004), the UV photons from the BLR likely act as the soft photons for the photo-pion processes.
During the photo-pion interaction, protons transfer 3/8 of their energy to neutrinos, while the remaining 5/8 corresponds to the production of electrons and pionic γ rays. Subsequent electromagnetic cascades are initiated, leading to a potential contribution on the detected electromagnetic radiations. We note that synchrotron cooling is likely dominant here, due to the Klein-Nishina suppression in the inverse Compton scattering. The connection between neutrino radiation and related γ-ray emission from the cascade is suggested in Murase et al. (2018):
 (2)
(2)
YIC represents the Compton-Y parameter for pairs from the cascades, which is typically ≤1 (Murase et al. 2018). If a Doppler factor value of 2.4 as well as a magnetic-field intensity of  are set, the synchrotron radiations by the secondary pairs from the cascades peak at
  . In the most optimistic scenario, the observed γ-ray emissions at such an energy could be overwhelmed by emissions from the secondary pairs. Or, conservatively, emissions from the primary leptons are dominant. Since the typical relative uncertainty for Fermi-LAT estimations is roughly 20%, and the observed luminosity at 0.3 GeV is about 5 × 1043 erg s−1 (shown in Figure 5),
  = 1043 erg s−1 is assumed. Therefore, a (anti-)muon neutrino luminosity of 4 × 1042 erg s−1 is expected. Compared to the luminosity of muon neutrinos inferred from the detection of IC-180213A, the probability of observing such a neutrino due to Poisson fluctuations is approximately 0.03.
Moreover, investigations on the kinetic energy of the jet based on the detection of the neutrino have been performed. As mentioned above, an all-flavor neutrino luminosity is described by 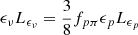 , where the optical depth for pπ processes (fpπ) accounts for the efficiency of neutrino production. For 3C 120, BLR photons, which are described as a blackbody distribution with a temperature of 42 000 K, are considered as target photons in the photo-pion processes. The optical depth for pπ processes is approximated by
 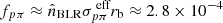 (Murase et al. 2014), where
  denotes the photon density at ϵt = 25 eV,
 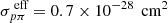 is the effective cross-section for pπ interactions (Murase et al. 2016), and rb represents the location of the emission region. Corresponding to flare III, the proton luminosity is constrained as ϵpLϵp ≈ 3.6 × 1046 erg s−1. Assuming a power-law spectrum for protons (
 with γ = 2,
 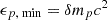 , and
, and  , where
  is the proton rest energy), together with δ = 2.4, the proton luminosity Lp is given by
  . In the AGN frame, the jet proton luminosity
  is approximately
  . Such a value is about three times the Eddington luminosity, 7 × 1045 erg s−1, which is consistent with the results for other neutrino emitting candidates (e.g., Cerruti et al. 2019; Gao et al. 2019; Rodrigues et al. 2021).
Alternative external photon scenarios are worth discussing. One option is that the emission region is at the vicinity of the SMBH, where UV and X-ray photons from the disk and corona are intense. Although in such an extreme environment, productions of neutrinos could be efficiently enhanced (e.g., Inoue et al. 2020; Murase et al. 2020), the attenuation of GeV, and sub-GeV, γ-ray photons is likely severe. Therefore, the temporal coincidence between a rise of the γ-ray flux and arrival of a neutrino is not anticipated. On the other hand, the emission region could be distant from the central engine, at a sub-parsec distance, where the infrared emissions from the dust torus are the external photons. In this circumstance, the photon number density is orders of magnitude lower than that from emissions of the BLR, and hence the production of neutrinos is suppressed. Moreover, considering a typical energy of photons from the hot dust of roughly 0.5 eV, the energy of the corresponding IceCube neutrino would be at 5 PeV, which is much higher than that of IC-180213A (0.111 PeV). Conclusively, the UV photons from the BLR appear to be the suitable soft photons for the photo-pion processes.
So far, more than 60 MAGNs have been detected by Fermi-LAT. The majority of them are radio galaxies (Ballet et al. 2023). As shown in Figure 6a, 3C 120 is one of the brightest radio galaxies. Meanwhile, it is one of the few of its kind possessing significant GeV γ-ray variability. Furthermore, 3C 120 is at the horizon level of the IceCube, which is ideal for the IceCube detection. For a neutrino at energy of 0.111 PeV such as IC-180213A, the GFU Bronze+Gold effective area at a declination value of several degrees (i.e., 0° < δ < 30°), is orders of magnitude larger than that at the deep southern hemisphere (i.e., δ < −5°) and slightly larger than that in other directions (i.e., δ > 30° as well as −5° < δ < 0°). Therefore, it is not surprising that 3C 120 is the first radio galaxy proposed as a neutrino emitter. Besides 3C 120, there are a few other radio galaxies worth noting for future neutrino detections. The first one is NGC 1275, the most powerful and active radio galaxy in the GeV domain (Ballet et al. 2023). However, since the declination angle of NGC 1275 is +41.3°, its IceCube effective area could be significantly reduced compared with 3C 120 if the energy of the arrival neutrino reaches ≃1 PeV (Abbasi et al. 2023). Other sources include M 87 and NGC 1218. Strong TeV variations have been detected in M 87 (Beilicke et al. 2008), while the GeV γ-ray behavior and the sky declination of the latter are similar to 3C 120.
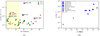 |
Fig. 6. (a): Comparison of 3C 120 with other GeV γ-ray radio galaxies. The red asterisks represent FR I radio galaxies, while the green circles denote FR II ones. The sources enclosed by black circles demonstrate significant (> 99%) long-term GeV γ-ray variability (Ballet et al. 2023). Note that M 87 exhibits pronounced variability in the TeV γ-ray domain. The yellow shaded area represents the optimal declination range for IceCube’s effective area. (b): Comparison between 3C 120 and neutrino-emitting candidates. The blue shapes represent blazars, the red shapes correspond to the radio galaxy 3C 120, and the green shapes denote the Seyfert II galaxy NGC 1068. Since other radio-quiet Seyfert galaxy candidates are not included in 4FGL-DR4 (Ballet et al. 2023), they are not plotted here. |
In the nearby Universe (i.e., z < 0.05), in addition to NGC 1068 (IceCube Collaboration 2022), 3C 120 is another neutrino-emitting candidate. However, origins of the neutrino production of these two sources are likely different. As a radio-quiet source, neutrinos of NGC 1068 are proposed to be from outflow-ISM interaction roughly 50 pc away from the central engine (Fang et al. 2023) or at a place near the SMBH (Ajello et al. 2023). We note that the averaged γ-ray luminosity of 3C 120 is two orders of magnitude higher than that of NGC 1068 (see Figure 6b), and γ-ray emissions of 3C 120 are widely accepted to be from the relativistic jet (e.g., Abdo et al. 2010a; Kataoka et al. 2011; Janiak et al. 2016). The temporal coincidences between the arrival of the neutrino and the γ-ray flare further strengthen the connection between the neutrino and the jet. Results from theoretical studies support that the relativistic jets in radio galaxies are possible neutrino contributors (Becker Tjus et al. 2014; Blanco & Hooper 2017). Besides NGC 1068, recent studies have provided accumulating observational evidence that nearby radio-quiet Seyfert galaxies are potential neutrino sources. Neutrino excesses from the direction of NGC 4151 and CGCG 420-015 are reported at post-trial significances of nearly 3σ (Abbasi et al. 2025a,b), although for the former blazars in the same direction may contribute the neutrino radiations as well (Omeliukh et al. 2025). Analyses of publicly available ten-year IceCube dataset also suggest that NGC 3079 is likely another neutrino-emitting source (Neronov et al. 2024). Interestingly, two individual neutrino events, IC-220424A and IC-230416A, are co-spatial with NGC 7469 (Sommani et al. 2025). This evidence is not only important for exploring the origin of the extragalactic neutrinos, but also for shedding new light on the innermost region of the SMBH (e.g., Fiorillo et al. 2024).
It is also intriguing to compare 3C 120 with blazars that both spatially and temporally coincide with the incoming neutrinos (e.g., IceCube Collaboration 2018a; Garrappa et al. 2019; Sahakyan et al. 2023; Liao et al. 2022; Jiang et al. 2024; Kadler et al. 2016; Giommi et al. 2020). As shown in Figure 6b, the averaged γ-ray luminosity of 3C 120 (< 1044 erg s−1) is generally two orders of magnitude lower than that of the blazars by ∼1046 erg s−1. Due to the relatively large inclination jet angle, the Doppler boost effect of 3C 120 is likely suppressed. As the first neutrino-emitting radio galaxy candidate, 3C 120 serves as a unique target, which offers a different perspective than blazars for approaching the production of neutrinos. In fact, 3C 120 fills in the blank between the blazars and NGC 1068. Moreover, analyses of the IceCube data suggest that luminous sources (i.e., blazars) are unlikely to be the dominant population for extragalactic neutrinos (Aartsen et al. 2017). On the other hand, relatively less powerful sources such as nearby radio galaxies, starbursts, and galaxy clusters and groups, are likely preferred, and a detection of the few brightest objects is enabled (Murase & Waxman 2016). Our study of 3C 120 indeed encourages such a proposition. Future cases such as 3C 120 would be crucial to a comprehensive understanding of the source of the IceCube diffuse neutrinos.
In summary, based on the multiwavelength observations of 3C 120, we suggest that it is likely associated with the neutrino event IC-180213A. 3C 120 is identified as the unique co-spatial γ-ray source at the time of the neutrino’s arrival. In fact, a prominent γ-ray flare that is the second strongest one among the entire 16-year, is temporally coincident with the income of IC-180213A. Correlated optical brightenings in the V and g bands observed by ASAS-SN have also been detected. Monte Carlo simulations give a probability of ∼0.04 of a chance association. Although the estimated significance is a posteriori and should be treated with caution, a potential link between 3C 120 and the neutrino is suggested. It is the first radio galaxy proposed as a neutrino emitter, filling in the blank between the blazars and the nearby radio quiet Seyfert galaxies, such as NGC 1068. Theoretical constraints on the jet properties of 3C 120 have been investigated, and comparisons with other neutrino-emitting candidates have been performed.
Acknowledgments
We appreciate the instructive suggestions from the anonymous referee that led to a substantial improvement of this work. We appreciate Dr. A. B. Pushkarev for sharing their adaptive-binned light curve data of 3C 120. This research has made use of data obtained from the High Energy Astrophysics Science Archive Research Center (HEASARC), provided by NASA’s Goddard Space Flight Center. This research has made use of data from the ASAS-SN project, which is supported by the Ohio State University and operated by the Ohio State Astronomy Department. This research has made use of the NASA/IPAC Infrared Science Archive, which is funded by the NASA and operated by the California Institute of Technology. This research uses data products from the Wide-field Infrared Survey Explorer, which is a joint project of the University of California, Los Angeles, and the Jet Propulsion Laboratory/California Institute of Technology, funded by the National Aeronautics and Space Administration. This research also makes use of data products from NEOWISE-R, which is a project of the Jet Propulsion Laboratory/California Institute of Technology, funded by the Planetary Science Division of the National Aeronautics and Space Administration. This research has made use of the RATAN-600 data, provided by the Special Astrophysical Observatory of the Russian Academy of Sciences (SAO RAS). This work was supported in part by the NSFC under grants U2031120. This work was also supported in part by the Guizhou Provincial Science and Technology Projects (No. QKHFQ[2023]003 and No. QKHPTRC-ZDSYS[2023]003).
References
- Aartsen, M. G., Abraham, K., Ackermann, M., et al. 2015, Phys. Rev. Lett., 115, 081102 [NASA ADS] [CrossRef] [Google Scholar]
- Aartsen, M. G., Abraham, K., Ackermann, M., et al. 2017, ApJ, 835, 45 [Google Scholar]
- Abbasi, R., Ackermann, M., Adams, J., et al. 2023, ApJS, 269, 25 [CrossRef] [Google Scholar]
- Abbasi, R., Ackermann, M., Adams, J., et al. 2025a, ApJ, 988, 141 [Google Scholar]
- Abbasi, R., Ackermann, M., Adams, J., et al. 2025b, ApJ, 981, 131 [Google Scholar]
- Abdo, A. A., Ackermann, M., Ajello, M., et al. 2010a, ApJ, 720, 912 [NASA ADS] [CrossRef] [Google Scholar]
- Abdo, A. A., Ackermann, M., Agudo, I., et al. 2010b, ApJ, 716, 30 [NASA ADS] [CrossRef] [Google Scholar]
- Abdo, A. A., Ackermann, M., Ajello, M., et al. 2011, ApJ, 733, L26 [NASA ADS] [CrossRef] [Google Scholar]
- Abdollahi, S., Acero, F., Ackermann, M., et al. 2020, ApJS, 247, 33 [Google Scholar]
- Aharonian, F., Akhperjanian, A., Beilicke, M., et al. 2003, A&A, 403, L1 [NASA ADS] [CrossRef] [EDP Sciences] [Google Scholar]
- Aharonian, F., Akhperjanian, A. G., Anton, G., et al. 2009, ApJ, 695, L40 [Google Scholar]
- Ajello, M., Baldini, L., Ballet, J., et al. 2022, ApJS, 263, 24 [NASA ADS] [CrossRef] [Google Scholar]
- Ajello, M., Murase, K., & McDaniel, A. 2023, ApJ, 954, L49 [NASA ADS] [CrossRef] [Google Scholar]
- Aleksić, J., Alvarez, E. A., Antonelli, L. A., et al. 2012, A&A, 539, L2 [NASA ADS] [CrossRef] [EDP Sciences] [Google Scholar]
- Aleksić, J., Ansoldi, S., Antonelli, L. A., et al. 2014, Science, 346, 1080 [Google Scholar]
- Antonucci, R. 1993, ARA&A, 31, 473 [Google Scholar]
- Atoyan, A., & Dermer, C. D. 2001, Phys. Rev. Lett., 87, 221102 [CrossRef] [PubMed] [Google Scholar]
- Baghmanyan, V., Gasparyan, S., & Sahakyan, N. 2017, ApJ, 848, 111 [NASA ADS] [CrossRef] [Google Scholar]
- Ballet, J., Bruel, P., Burnett, T. H., Lott, B., & The Fermi-LAT collaboration. 2023, ArXiv e-prints [arXiv:2307.12546] [Google Scholar]
- Becker Tjus, J., Eichmann, B., Halzen, F., Kheirandish, A., & Saba, S. M. 2014, Phys. Rev. D, 89, 123005 [Google Scholar]
- Beilicke, M., Aharonian, F., Benbow, W., et al. 2008, Int. Cosm. Ray Conf., 3, 937 [Google Scholar]
- Blanco, C., & Hooper, D. 2017, JCAP, 2017, 017 [CrossRef] [Google Scholar]
- Blandford, R. D., & Rees, M. J. 1978, in BL Lac Objects, ed. A. M. Wolfe, 328 [Google Scholar]
- Blandford, R., Meier, D., & Readhead, A. 2019, ARA&A, 57, 467 [NASA ADS] [CrossRef] [Google Scholar]
- Burbidge, E. M. 1967, ApJ, 149, L51 [Google Scholar]
- Burrows, D. N., Hill, J. E., Nousek, J. A., et al. 2005, Space Sci. Rev., 120, 165 [Google Scholar]
- Cerruti, M., Zech, A., Boisson, C., et al. 2019, MNRAS, 483, L12 [NASA ADS] [CrossRef] [Google Scholar]
- Chang, Y. L., Brandt, C. H., & Giommi, P. 2020, Astron. Comput., 30, 100350 [NASA ADS] [CrossRef] [Google Scholar]
- Fanaroff, B. L., & Riley, J. M. 1974, MNRAS, 167, 31P [Google Scholar]
- Fang, K., Lopez Rodriguez, E., Halzen, F., & Gallagher, J. S. 2023, ApJ, 956, 8 [NASA ADS] [CrossRef] [Google Scholar]
- Fang, K., Halzen, F., Heinz, S., & Gallagher, J. S. 2024, ApJ, 975, L35 [Google Scholar]
- Fiorillo, D. F. G., Comisso, L., Peretti, E., Petropoulou, M., & Sironi, L. 2024, ApJ, 974, 75 [NASA ADS] [CrossRef] [Google Scholar]
- Franckowiak, A., Garrappa, S., Paliya, V., et al. 2020, ApJ, 893, 162 [Google Scholar]
- Gagliardini, S., Langella, A., Guetta, D., & Capone, A. 2024, ApJ, 969, 161 [Google Scholar]
- Gao, S., Fedynitch, A., Winter, W., & Pohl, M. 2019, Nat. Astron., 3, 88 [NASA ADS] [CrossRef] [Google Scholar]
- Garrappa, S., Buson, S., Franckowiak, A., et al. 2019, ApJ, 880, 103 [NASA ADS] [CrossRef] [Google Scholar]
- Gehrels, N., Chincarini, G., Giommi, P., et al. 2004, ApJ, 611, 1005 [Google Scholar]
- Ghisellini, G. 2013, Radiative Processes in High Energy Astrophysics, 873 (Switzerland: Springer International Publishing) [Google Scholar]
- Giommi, P., Padovani, P., Oikonomou, F., et al. 2020, A&A, 640, L4 [NASA ADS] [CrossRef] [EDP Sciences] [Google Scholar]
- Giommi, P., Perri, M., Capalbi, M., et al. 2021, MNRAS, 507, 5690 [NASA ADS] [CrossRef] [Google Scholar]
- Halzen, F., & Kheirandish, A. 2016, ApJ, 831, 12 [Google Scholar]
- Hart, K., Shappee, B. J., Hey, D., et al. 2023, ArXiv e-prints [arXiv:2304.03791] [Google Scholar]
- Henden, A. A., Levine, S. E., Terrell, D., Smith, T. C., & Welch, D. 2012, JAAVSO, 40, 430 [Google Scholar]
- Hovatta, T., Valtaoja, E., Tornikoski, M., & Lähteenmäki, A. 2009, A&A, 494, 527 [CrossRef] [EDP Sciences] [Google Scholar]
- IceCube Collaboration. 2013, Science, 342, 1242856 [Google Scholar]
- IceCube Collaboration (Aartsen, M. G., et al.) 2018a, Science, 361, eaat1378 [NASA ADS] [Google Scholar]
- IceCube Collaboration (Aartsen, M. G., et al.) 2018b, Science, 361, 147 [NASA ADS] [Google Scholar]
- IceCube Collaboration (Abbasi, R., et al.) 2022, Science, 378, 538 [CrossRef] [PubMed] [Google Scholar]
- Icecube Collaboration (Abbasi, R., et al.) 2023, Science, 380, 1338 [NASA ADS] [CrossRef] [Google Scholar]
- Inoue, Y., Khangulyan, D., & Doi, A. 2020, ApJ, 891, L33 [Google Scholar]
- Janiak, M., Sikora, M., & Moderski, R. 2016, MNRAS, 458, 2360 [Google Scholar]
- Jiang, N., Wang, T., Dou, L., et al. 2021, ApJS, 252, 32 [Google Scholar]
- Jiang, X., Liao, N.-H., Wang, Y.-B., et al. 2024, ApJ, 965, L2 [Google Scholar]
- Jorstad, S. G., Marscher, A. P., Lister, M. L., et al. 2005, AJ, 130, 1418 [Google Scholar]
- Kadler, M., Krauß, F., Mannheim, K., et al. 2016, Nat. Phys., 12, 807 [Google Scholar]
- Kataoka, J., Stawarz, Ł., Takahashi, Y., et al. 2011, ApJ, 740, 29 [NASA ADS] [CrossRef] [Google Scholar]
- Kochanek, C. S., Shappee, B. J., Stanek, K. Z., et al. 2017, PASP, 129, 104502 [Google Scholar]
- Kramarenko, I. G., Pushkarev, A. B., Kovalev, Y. Y., et al. 2022, MNRAS, 510, 469 [Google Scholar]
- Kreter, M., Kadler, M., Krauß, F., et al. 2020, ApJ, 902, 133 [Google Scholar]
- León-Tavares, J., Lobanov, A. P., Chavushyan, V. H., et al. 2010, ApJ, 715, 355 [Google Scholar]
- Liao, N. H., Bai, J. M., Liu, H. T., et al. 2014, ApJ, 783, 83 [CrossRef] [Google Scholar]
- Liao, N.-H., Dou, L.-M., Jiang, N., et al. 2019, ApJ, 879, L9 [NASA ADS] [CrossRef] [Google Scholar]
- Liao, N.-H., Sheng, Z.-F., Jiang, N., et al. 2022, ApJ, 932, L25 [NASA ADS] [CrossRef] [Google Scholar]
- Lister, M. L., Homan, D. C., Kellermann, K. I., et al. 2021, ApJ, 923, 30 [NASA ADS] [CrossRef] [Google Scholar]
- Loeb, A., & Waxman, E. 2006, JCAP, 2006, 003 [NASA ADS] [CrossRef] [Google Scholar]
- Lott, B., Escande, L., Larsson, S., & Ballet, J. 2012, A&A, 544, A6 [NASA ADS] [CrossRef] [EDP Sciences] [Google Scholar]
- Mainzer, A., Masiero, J., Bauer, J., et al. 2020, AAS/Div. Planet. Sci. Meet. Abstr., 52, 208.01 [Google Scholar]
- Marscher, A. P., Jorstad, S. G., Gómez, J.-L., et al. 2002, Nature, 417, 625 [NASA ADS] [CrossRef] [Google Scholar]
- Mattox, J. R., Bertsch, D. L., Chiang, J., et al. 1996, ApJ, 461, 396 [Google Scholar]
- Mingaliev, M. G., Sotnikova, Y. V., Udovitskiy, R. Y., et al. 2014, A&A, 572, A59 [NASA ADS] [CrossRef] [EDP Sciences] [Google Scholar]
- Murase, K., & Waxman, E. 2016, Phys. Rev. D, 94, 103006 [NASA ADS] [CrossRef] [Google Scholar]
- Murase, K., Inoue, S., & Nagataki, S. 2008, ApJ, 689, L105 [Google Scholar]
- Murase, K., Inoue, Y., & Dermer, C. D. 2014, Phys. Rev. D, 90, 023007 [Google Scholar]
- Murase, K., Guetta, D., & Ahlers, M. 2016, Phys. Rev. Lett., 116, 071101 [NASA ADS] [CrossRef] [Google Scholar]
- Murase, K., Oikonomou, F., & Petropoulou, M. 2018, ApJ, 865, 124 [Google Scholar]
- Murase, K., Kimura, S. S., & Mészáros, P. 2020, Phys. Rev. Lett., 125, 011101 [Google Scholar]
- Neronov, A., Savchenko, D., & Semikoz, D. V. 2024, Phys. Rev. Lett., 132, 101002 [NASA ADS] [CrossRef] [Google Scholar]
- Nolan, P. L., Abdo, A. A., Ackermann, M., et al. 2012, ApJS, 199, 31 [Google Scholar]
- Oikonomou, F., Petropoulou, M., Murase, K., et al. 2021, JCAP, 2021, 082 [CrossRef] [Google Scholar]
- Omeliukh, A., Barnier, S., & Inoue, Y. 2025, A&A, 694, A203 [NASA ADS] [CrossRef] [EDP Sciences] [Google Scholar]
- Parijskij, Y. N. 1993, IEEE Antennas Propag. Mag., 35, 7 [CrossRef] [Google Scholar]
- Peterson, B. M., Ferrarese, L., Gilbert, K. M., et al. 2004, ApJ, 613, 682 [Google Scholar]
- Petropoulou, M., Coenders, S., & Dimitrakoudis, S. 2016, Astropart. Phys., 80, 115 [Google Scholar]
- Planck Collaboration XVI. 2014, A&A, 571, A16 [NASA ADS] [CrossRef] [EDP Sciences] [Google Scholar]
- Poutanen, J., & Stern, B. 2010, ApJ, 717, L118 [Google Scholar]
- Pozo Nuñez, F., Haas, M., Ramolla, M., et al. 2014, A&A, 568, A36 [NASA ADS] [CrossRef] [EDP Sciences] [Google Scholar]
- Rieger, F. M. 2022, Universe, 8, 607 [NASA ADS] [CrossRef] [Google Scholar]
- Rodrigues, X., Garrappa, S., Gao, S., et al. 2021, ApJ, 912, 54 [NASA ADS] [CrossRef] [Google Scholar]
- Sahakyan, N., Zargaryan, D., & Baghmanyan, V. 2015, A&A, 574, A88 [NASA ADS] [CrossRef] [EDP Sciences] [Google Scholar]
- Sahakyan, N., Giommi, P., Padovani, P., et al. 2023, MNRAS, 519, 1396 [Google Scholar]
- Scargle, J. D., Norris, J. P., Jackson, B., & Chiang, J. 2013, ApJ, 764, 167 [Google Scholar]
- Shappee, B. J., Prieto, J. L., Grupe, D., et al. 2014, ApJ, 788, 48 [Google Scholar]
- Sommani, G., Franckowiak, A., Lincetto, M., & Dettmar, R.-J. 2025, ApJ, 981, 103 [Google Scholar]
- Sotnikova, Y. V., Mufakharov, T. V., Mingaliev, M. G., et al. 2022, Astrophys. Bull., 77, 361 [Google Scholar]
- Tanaka, Y. T., Doi, A., Inoue, Y., et al. 2015, ApJ, 799, L18 [NASA ADS] [CrossRef] [Google Scholar]
- Tavecchio, F., Maraschi, L., & Ghisellini, G. 1998, ApJ, 509, 608 [Google Scholar]
- Ulrich, M.-H., Maraschi, L., & Urry, C. M. 1997, ARA&A, 35, 445 [NASA ADS] [CrossRef] [Google Scholar]
- Urry, C. M., & Padovani, P. 1995, PASP, 107, 803 [NASA ADS] [CrossRef] [Google Scholar]
- WISE Team 2020, NEOWISE 2-Band Post-Cryo Single Exposure (L1b) Source Table [Google Scholar]
- Wright, E. L., Eisenhardt, P. R. M., Mainzer, A. K., et al. 2010, AJ, 140, 1868 [Google Scholar]
- Zargaryan, D., Gasparyan, S., Baghmanyan, V., & Sahakyan, N. 2017, A&A, 608, A37 [NASA ADS] [CrossRef] [EDP Sciences] [Google Scholar]
Quantities with “obs” subscripts pertain to the observer’s frame, while those with primes refer to the frame co-moving with the jet. All others are in the cosmic rest frame unless stated otherwise.
All Tables
All Figures
|
Fig. 1. Smoothed γ-ray TS maps (8° ×8° scale with 0.2° per pixel) based on Fermi-LAT data between MJD 58072 and MJD 58252. Panel 1a corresponds to an analysis source model without 4FGL J0433.0+0522, while in the residual TS map (i.e., panel 1b), the target is included. The green X-shaped symbol and ellipse represent optimized position and positional uncertainties of the neutrino, respectively. The red and yellow crosses are the optimized γ-ray locations of 4FGL J0433.0+0522 and 4FGL J0426.5+0517, respectively, together with the corresponding 95% C.L. γ-ray localization error radii (green circles). The white crosses represent other γ-ray sources in the 4FGL-DR4 catalog. |
| In the text | |
|
Fig. 2. One-year time bin γ-ray light curve of 4FGL J0433.0+0522. The blue circles and red triangles correspond to flux estimations and upper limits, with TS values indicated by red bars. The orange hollow squares represent data from the Fermi-LAT public light curve. The gray shaded region shows the epoch of high-state γ-ray flux by Bayesian block analyses, and the green shaded region marks the 16-year averaged γ-ray flux. The red vertical dashed line marks the arrival time of IC-180213A. |
| In the text | |
|
Fig. 3. Multiwavelength light curves of 3C 120. The panels from top to bottom are the adaptive-binning Fermi-LAT γ-ray light curve, the 1 keV light curve from Swift-XRT, the ASAS-SN weekly binned light curves, the NEOWISE light curves, and the multifrequency radio light curves from RATAN-600, respectively. The three shaded gray regions correspond to the time periods of γ-ray flares, while the red dashed vertical line represents the neutrino arrival time. |
| In the text | |
|
Fig. 4. Zoomed-in view of γ-ray and optical light curves. Left panel: Fermi-LAT one-day time bin γ-ray light curve during the period from MJD 58179 to 58199. The gray data points indicate time bins with no Fermi-LAT exposures. The 16-year averaged γ-ray flux is also plotted on the green horizontal line, as is its uncertainty. Right panel: ASAS-SN light curves in the V and g bands at a time range between MJD 58100 and 58360. |
| In the text | |
|
Fig. 5. Broadband SED of 3C 120 quasi-simultaneous data are displayed in color. The horizon line indicates the energy-averaged neutrino energy flux over a six-month duration. In contrast, the X-shaped symbols denote theoretical expectations of neutrinos. Non-simultaneous archival data are in gray. |
| In the text | |
|
Fig. 6. (a): Comparison of 3C 120 with other GeV γ-ray radio galaxies. The red asterisks represent FR I radio galaxies, while the green circles denote FR II ones. The sources enclosed by black circles demonstrate significant (> 99%) long-term GeV γ-ray variability (Ballet et al. 2023). Note that M 87 exhibits pronounced variability in the TeV γ-ray domain. The yellow shaded area represents the optimal declination range for IceCube’s effective area. (b): Comparison between 3C 120 and neutrino-emitting candidates. The blue shapes represent blazars, the red shapes correspond to the radio galaxy 3C 120, and the green shapes denote the Seyfert II galaxy NGC 1068. Since other radio-quiet Seyfert galaxy candidates are not included in 4FGL-DR4 (Ballet et al. 2023), they are not plotted here. |
| In the text | |
Current usage metrics show cumulative count of Article Views (full-text article views including HTML views, PDF and ePub downloads, according to the available data) and Abstracts Views on Vision4Press platform.
Data correspond to usage on the plateform after 2015. The current usage metrics is available 48-96 hours after online publication and is updated daily on week days.
Initial download of the metrics may take a while.