Fig. 3.
Download original image
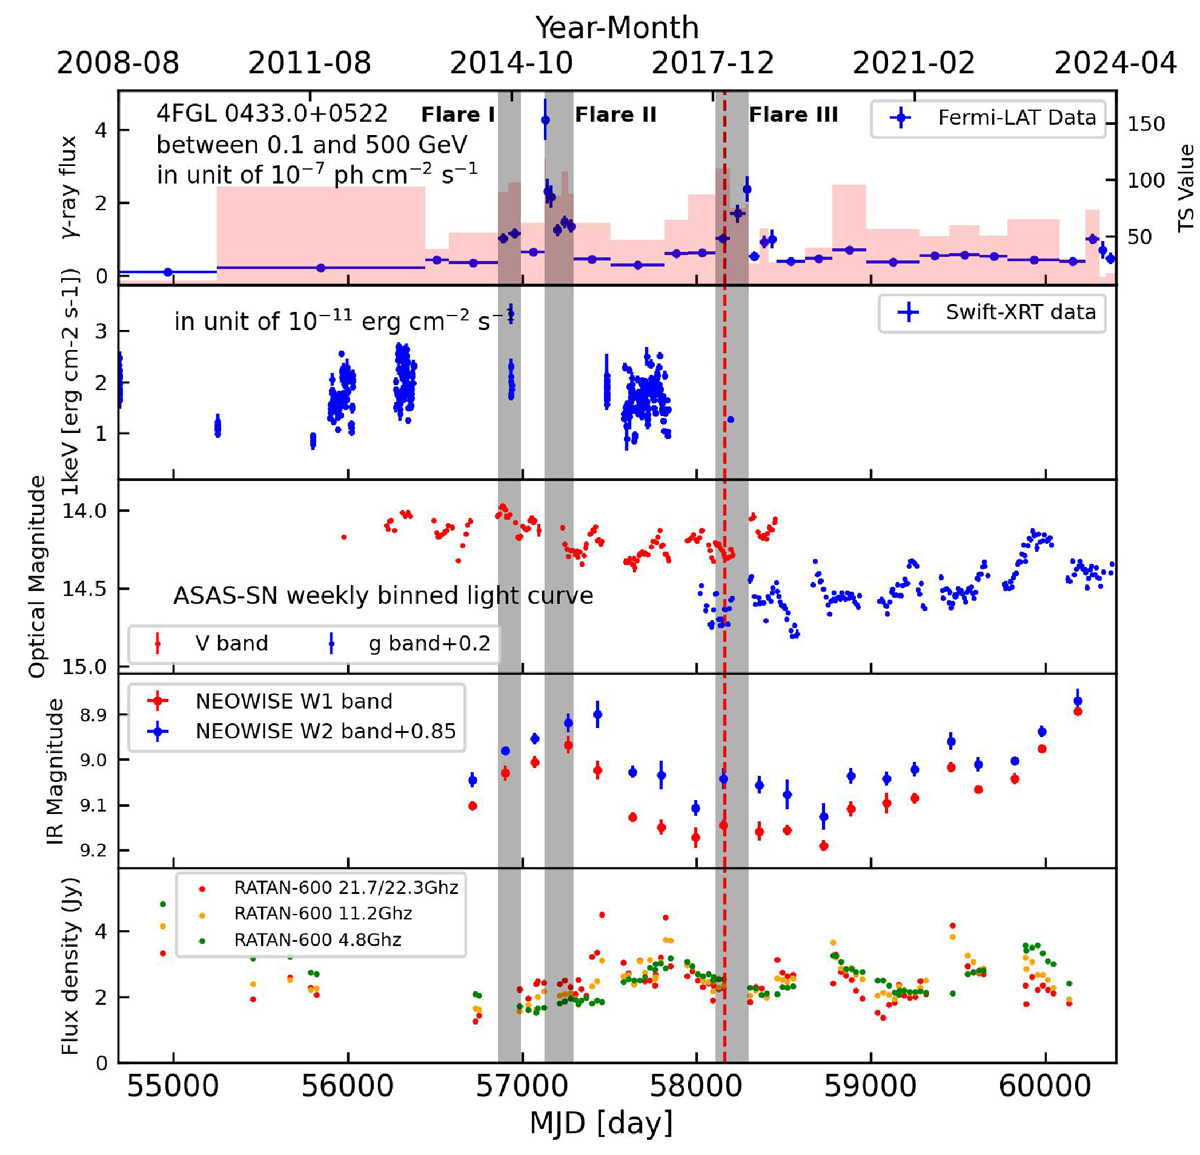
Multiwavelength light curves of 3C 120. The panels from top to bottom are the adaptive-binning Fermi-LAT γ-ray light curve, the 1 keV light curve from Swift-XRT, the ASAS-SN weekly binned light curves, the NEOWISE light curves, and the multifrequency radio light curves from RATAN-600, respectively. The three shaded gray regions correspond to the time periods of γ-ray flares, while the red dashed vertical line represents the neutrino arrival time.
Current usage metrics show cumulative count of Article Views (full-text article views including HTML views, PDF and ePub downloads, according to the available data) and Abstracts Views on Vision4Press platform.
Data correspond to usage on the plateform after 2015. The current usage metrics is available 48-96 hours after online publication and is updated daily on week days.
Initial download of the metrics may take a while.