Fig. 4.
Download original image
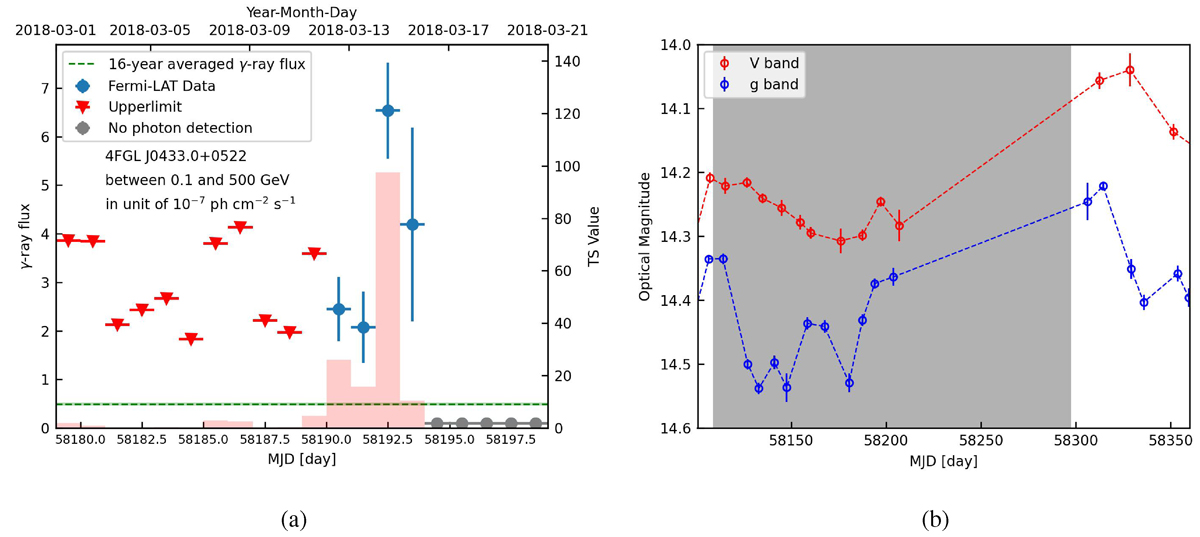
Zoomed-in view of γ-ray and optical light curves. Left panel: Fermi-LAT one-day time bin γ-ray light curve during the period from MJD 58179 to 58199. The gray data points indicate time bins with no Fermi-LAT exposures. The 16-year averaged γ-ray flux is also plotted on the green horizontal line, as is its uncertainty. Right panel: ASAS-SN light curves in the V and g bands at a time range between MJD 58100 and 58360.
Current usage metrics show cumulative count of Article Views (full-text article views including HTML views, PDF and ePub downloads, according to the available data) and Abstracts Views on Vision4Press platform.
Data correspond to usage on the plateform after 2015. The current usage metrics is available 48-96 hours after online publication and is updated daily on week days.
Initial download of the metrics may take a while.