Fig. 1
Download original image
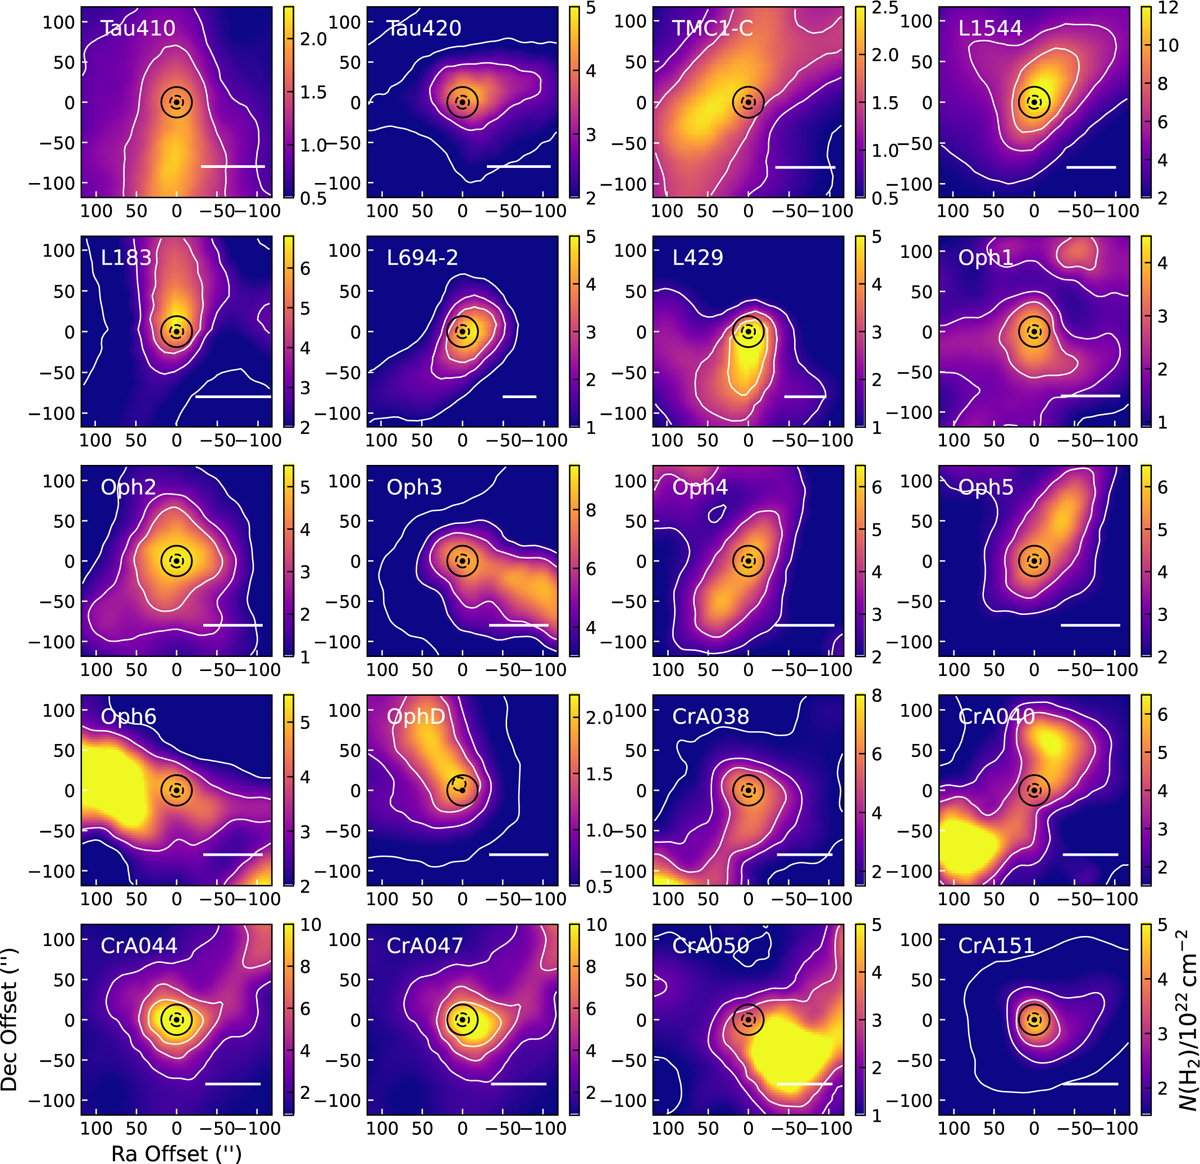
N(H2) maps towards each core in the sample (labelled in the top left corner of every panel). The scale bar shown in the bottom right corner represents a length of 0.05 pc. The white contours show the 20, 40, and 60% levels of the peak value within the central Herschel beam. The solid circles show the APEX pointing and the N(H2) map beam size, whilst the dashed circles show the beam sizes and pointings of APEX for the oH2D+ line. Note the small shift present between the two positions for Oph D, where the oH2D+ beam is not the central LAsMA beam, but one of the external ones (see main text). The shift is, however, smaller than the continuum and APEX resolutions.
Current usage metrics show cumulative count of Article Views (full-text article views including HTML views, PDF and ePub downloads, according to the available data) and Abstracts Views on Vision4Press platform.
Data correspond to usage on the plateform after 2015. The current usage metrics is available 48-96 hours after online publication and is updated daily on week days.
Initial download of the metrics may take a while.