Fig. 10
Download original image
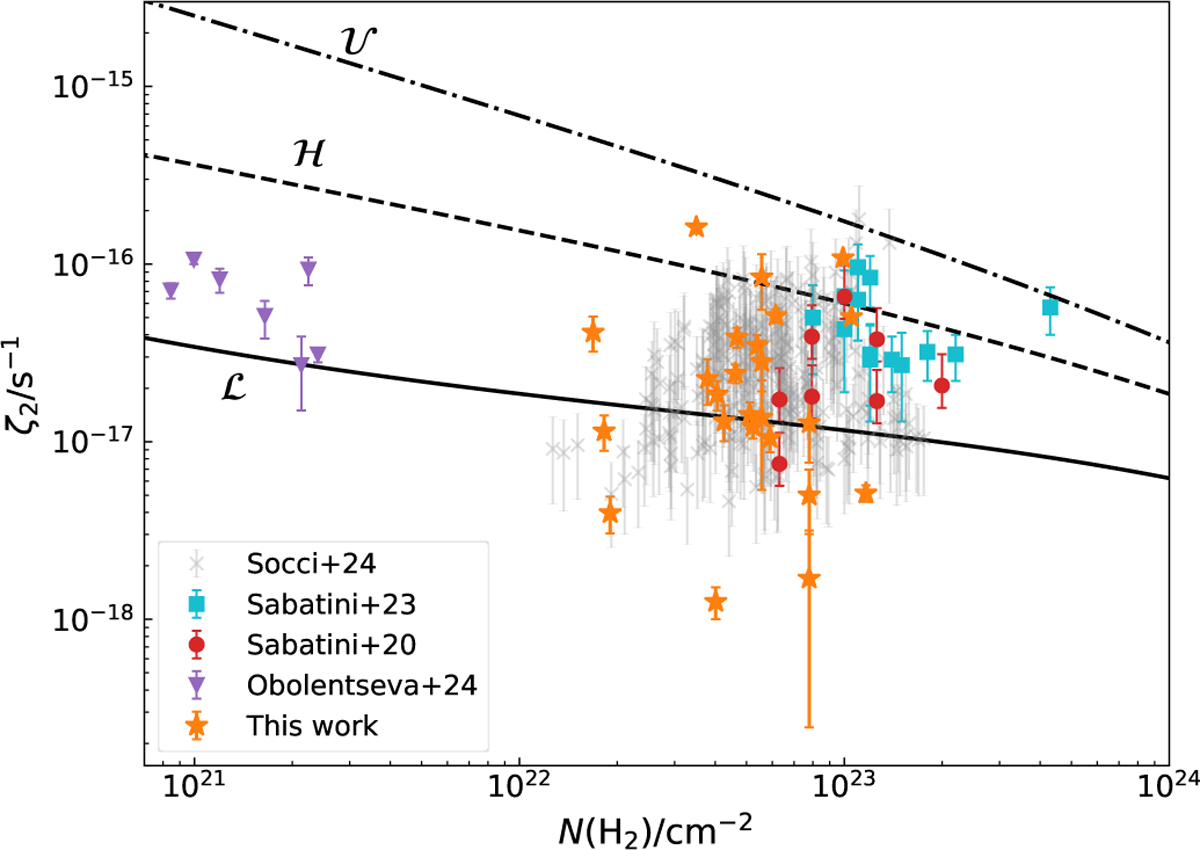
ζ2 as function of N(H2). The theoretical models ℒ (solid black line), ℋ (dashed black line), and 𝒰 (dotted-dashed black line) are taken from Padovani et al. (2022). The new observational estimates obtained in this work are shown with orange stars. The most recent values in the diffuse gas are shown with purple triangles (Obolentseva et al. 2024). We also show literature values in dense gas obtained with the method of Bovino et al. (2020), which are represented with red dots (Sabatini et al. 2020), cyan squares (Sabatini et al. 2023), and shaded grey crosses (Socci et al. 2024).
Current usage metrics show cumulative count of Article Views (full-text article views including HTML views, PDF and ePub downloads, according to the available data) and Abstracts Views on Vision4Press platform.
Data correspond to usage on the plateform after 2015. The current usage metrics is available 48-96 hours after online publication and is updated daily on week days.
Initial download of the metrics may take a while.