Open Access
Fig. 2
Download original image
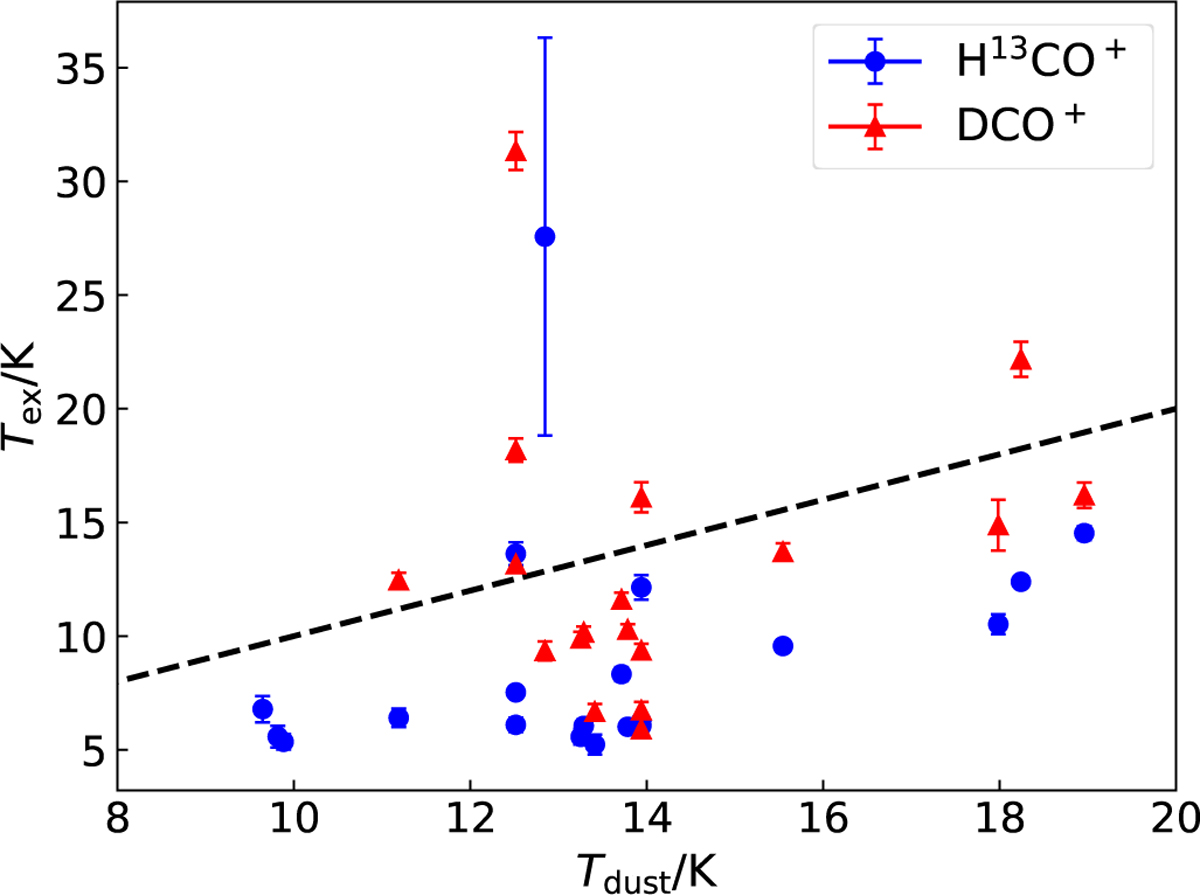
Tex of H13CO+ (blue circles) and DCO+ (red triangles) for all cores where two transitions of the species are available, as a function of Tdust values. The dashed black line shows the 1:1 relation. For cores where two velocity components are identified and fitted, we show the parameters of both.
Current usage metrics show cumulative count of Article Views (full-text article views including HTML views, PDF and ePub downloads, according to the available data) and Abstracts Views on Vision4Press platform.
Data correspond to usage on the plateform after 2015. The current usage metrics is available 48-96 hours after online publication and is updated daily on week days.
Initial download of the metrics may take a while.